Review
. 2014 Mar 24:6:149-70.
doi: 10.2147/CMAR.S54726. eCollection 2014.

Malignant gliomas: current perspectives in diagnosis, treatment, and early response assessment using advanced quantitative imaging methods

Affiliations
Review

Malignant gliomas: current perspectives in diagnosis, treatment, and early response assessment using advanced quantitative imaging methods

Rafay Ahmed et al. Cancer Manag Res. .

Abstract

Malignant gliomas consist of glioblastomas, anaplastic astrocytomas, anaplastic oligodendrogliomas and anaplastic oligoastrocytomas, and some less common tumors such as anaplastic ependymomas and anaplastic gangliogliomas. Malignant gliomas have high morbidity and mortality. Even with optimal treatment, median survival is only 12-15 months for glioblastomas and 2-5 years for anaplastic gliomas. However, recent advances in imaging and quantitative analysis of image data have led to earlier diagnosis of tumors and tumor response to therapy, providing oncologists with a greater time window for therapy management. In addition, improved understanding of tumor biology, genetics, and resistance mechanisms has enhanced surgical techniques, chemotherapy methods, and radiotherapy administration. After proper diagnosis and institution of appropriate therapy, there is now a vital need for quantitative methods that can sensitively detect malignant glioma response to therapy at early follow-up times, when changes in management of nonresponders can have its greatest effect. Currently, response is largely evaluated by measuring magnetic resonance contrast and size change, but this approach does not take into account the key biologic steps that precede tumor size reduction. Molecular imaging is ideally suited to measuring early response by quantifying cellular metabolism, proliferation, and apoptosis, activities altered early in treatment. We expect that successful integration of quantitative imaging biomarker assessment into the early phase of clinical trials could provide a novel approach for testing new therapies, and importantly, for facilitating patient management, sparing patients from weeks or months of toxicity and ineffective treatment. This review will present an overview of epidemiology, molecular pathogenesis and current advances in diagnoses, and management of malignant gliomas.

Keywords: FLT; MRI; PET; early therapy response assessment; glioblastoma multiforme; malignant gliomas; quantitative molecular imaging.


Figures
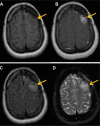
Figure 1
Figure 1
Magnetic resonance findings in GBM. Notes: (A) T1 pre-contrast images exhibit a hypointense lesion in the left frontal lobe region (arrow). (B) Axial T1 post-contrast images, after injection of 20 cc of intravenous MultiHance®, demonstrate a focus of enhancement in left frontal lobe. (C) Axial T2 FLAIR images show increase in FLAIR signal in the left frontal lobe, which demonstrates enhancement. (D) T2 FSE images also demonstrate increase in signal in the region of the left frontal lobe. Abbreviations: FLAIR, fluid-attenuated inversion recovery; FSE, fast spin-echo; GBM, glioblastoma multiforme.
Figure 2
Figure 2
Radiation necrosis versus viable tumor on MRI. Notes: Sixty-nine-year-old male with glioblastoma multiforme, status post-chemotherapy presented with dizziness. Contrast MRI and 18F-FDG PET were performed to evaluate for progression. Post-contrast T1 MR (A) is suggestive of rim enhancement of tumor (arrow). 18F-FDG PET (B) and PET-MR fusion (C) images show an area of relatively decreased activity corresponding to the area of rim enhancement. PET findings were diagnostic for nonviable tissue. In this case, MR was unable to differentiate between radiation changes and viable tumor. Abbreviations: FDG, 2-fluorodeoxyglucose; MR, magnetic resonance; MRI, magnetic resonance imaging; PET, positron emission tomography.
Figure 3
Figure 3
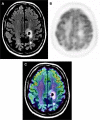
Magnetic resonance spectroscopy. Notes: Anaplastic astrocytoma, WHO grade III. Multiple-voxel spectra coregistered with post-contrast T1-weighted MRI (A). Map of Cho/Cr demonstrates a focus of signal intensity in the right frontal lobe (B). MRSI signal intensity is presented on a rainbow color scale where blue-green is normal background and bright red corresponds to greatly elevated signal intensity. Spectral analysis of the voxel demonstrating maximal Cho/Cr ratio (C). T1-weighted MRI (post-contrast) demonstrating enhancing lesion in the right frontal lobe (D). 18F-FDG PET scan shows a focus of increased tracer activity greater than white matter in the right frontal lobe (E). 18F-FDG PET image coregistered with post-contrast T1-weighted MRI (F). Reproduced with permission from John Wiley and Sons. Imani F, Boada FE, Lieberman FS, Davis DK, Deeb EL, Mountz JM. Comparison of proton magnetic resonance spectroscopy with fluorine-18 2-fluoro-deoxyglucose positron emission tomography for assessment of brain tumor progression. J Neuroimaging. 2012;22(2):184–190. Copyright © 2010 by the American Society of Neuroimaging. Abbreviations: Cho/Cr, choline/creatine; MRI, magnetic resonance imaging; MRS, magnetic resonance spectroscopy; NAA, N-acetylaspartate; WHO, World Health Organization; FDG, 2-fluorodeoxyglucose; PET, positron emission tomography.
Figure 4
Figure 4
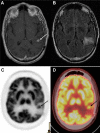
Tumor recurrence versus radiation induced changes: images of a 77-year-old male who was originally diagnosed with glioblastoma multiforme, treated with external beam radiation and adjuvant chemotherapy with temozolomide. Notes: Ten-month follow-up MR T1 post-contrast images (A) demonstrate a distinct area of enhancement (arrow) in the left temporoparietal lobe region of prior tumor. T2-weighted MR images (B) demonstrate hyperintense signal in the left parietal lobe extending to the left temporal lobe. This pathologic contrast enhancement is suggestive of an infiltrative mass. FDG PET only (C) and PET-CT fusion images (D) demonstrate a focus of increased FDG activity corresponding to an enhanced area of uptake on post-contrast T1 images. These findings are consistent with tumor recurrence. There is also decreased tracer uptake surrounding these areas consistent with vasogenic edema. Abbreviations: CT, computed tomography; FDG, 2-fluorodeoxyglucose; MR, magnetic resonance; PET, positron emission tomography.
Figure 5
Figure 5
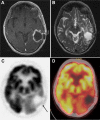
18F-FDG PET for tumor recurrence: 71-year-old male patient with history of glioblastoma multiforme, status post-resection presents for evaluation of recurrence. Notes: Contrast-enhanced MR T1 images (A) demonstrate a large cavity in the left posterotemporal-parietal junction with an irregular rim of enhancement. T2-weighted MR images (B) demonstrate hyperintensity in the posterotemporal and parietal lobes. These findings are suspicious for tumor recurrence around the periphery of previous location of mass in the left posterior temporoparietal region. (C) 18F-FDG PET only and (D) PET-CT fusion images demonstrate a relatively large area of absent 18F-FDG uptake corresponding to the cavity noted on MRI, with no area of abnormally increased 18F-FDG to suggest the presence of residual or recurrent high-grade viable tumor. Abbreviations: CT, computed tomography; FDG, 2-fluorodeoxyglucose; MR, magnetic resonance; MRI, magnetic resonance imaging; PET, positron emission tomography.
Figure 6
Figure 6
18F-FDG PET diagnosis of pseudoprogression. Notes: Patient with a history of glioblastoma, status post-resection, now after treatment with total dose of 60 Gy in 2-Gy fractions presents for a follow-up, 1 month after radiation therapy. MRI (A) demonstrates enhancement posterior to the prior resection cavity in the left frontal lobe (arrowhead). However, the patient showed clinical improvement, and therefore an 18F-FDG PET scan was done to assess for tumor progression. On PET (B), no abnormal areas of increased 18F-FDG uptake in the region of MRI contrast enhancement were identified (C), thus additional therapy was deemed not indicated; the patient was monitored on follow-up contrast-enhanced MRI scans, which were negative. Thus, PET scan was helpful in differentiating pseudoprogression from true progression. Adapted with permission from Lippincott Williams and Wilkins/Wolters Kluwer Health: Oborski MJ, Laymon CM, Lieberman FS, Mountz JM. Distinguishing pseudoprogression from progression in high-grade gliomas: a brief review of current clinical practice and demonstration of the potential value of 18F-FDG PET. Clin Nucl Med. 2013;38(5):381–384. Copyright © 2013. Promotional and commercial use of the material in print, digital or mobile device format is prohibited without the permission from the publisher Lippincott Williams and Wilkins. Please contact journalpermissions@lww.com for further information. Abbreviations: FDG, 2-fluorodeoxyglucose; MRI, magnetic resonance imaging; PET, positron emission tomography.
Figure 7
Figure 7
18F-FLT PET. Notes: Sixty-five-year-old female who initially presented with glioblastoma multiforme, now presents after completion of 6 weeks of temozolomide chemotherapy and a total of 60 Gy radiotherapy to the tumor. T1 post-contrast enhanced images (A) demonstrate slight progression as compared to prior study. However, FLT uptake post-therapy (C) was significantly decreased as compared to baseline scan (B). This finding was suggestive of a response to therapy. Abbreviations: FLT, fluoro-3′-deoxy-3′-l-fluorothymidine; PET, positron emission tomography; SUV, standardized uptake value.

Similar articles

Cited by

References

    1. Ferlay J, Shin HR, Bray F, Forman D, Mathers C, Parkin DM. Estimates of worldwide burden of cancer in 2008: GLOBOCAN 2008. Int J Cancer. 2010;127(12):2893–2917. - PubMed
    1. Louis DN, Ohgaki H, Wiestler OD, et al. The 2007 WHO classification of tumours of the central nervous system. Acta Neuropathol. 2007;114(2):97–109. - PMC - PubMed
    1. Ostrom QT, Gittleman H, Farah P, et al. CBTRUS Statistical Report: Primary Brain and Central Nervous System Tumors Diagnosed in the United States 2006–2010. Neuro-Oncol. 2013;15(sup 2):ii1–ii56. - PMC - PubMed
    1. Kleihues P, Louis DN, Scheithauer BW, et al. The WHO classification of tumors of the nervous system. J Neuropathol Exp Neurol. 2002;61(3):215–225. discussion 226–229. - PubMed
    1. Fisher JL, Schwartzbaum JA, Wrensch M, Wiemels JL. Epidemiology of brain tumors. Neurol Clin. 2007;25(4):867–890. vii. - PubMed