

Mapping the self-association domains of ataxin-1: identification of novel non overlapping motifs
- PMID: 24711972
- PMCID: PMC3970802
- DOI: 10.7717/peerj.323
Mapping the self-association domains of ataxin-1: identification of novel non overlapping motifs
Abstract
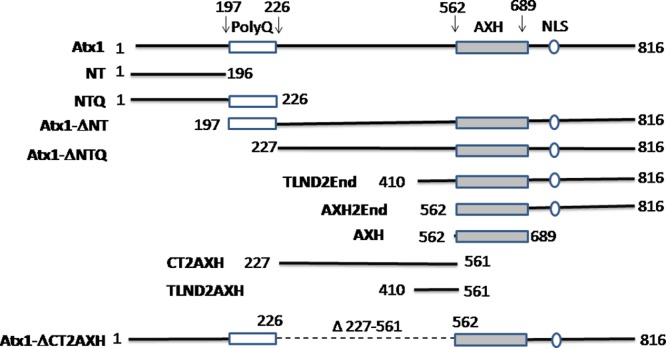
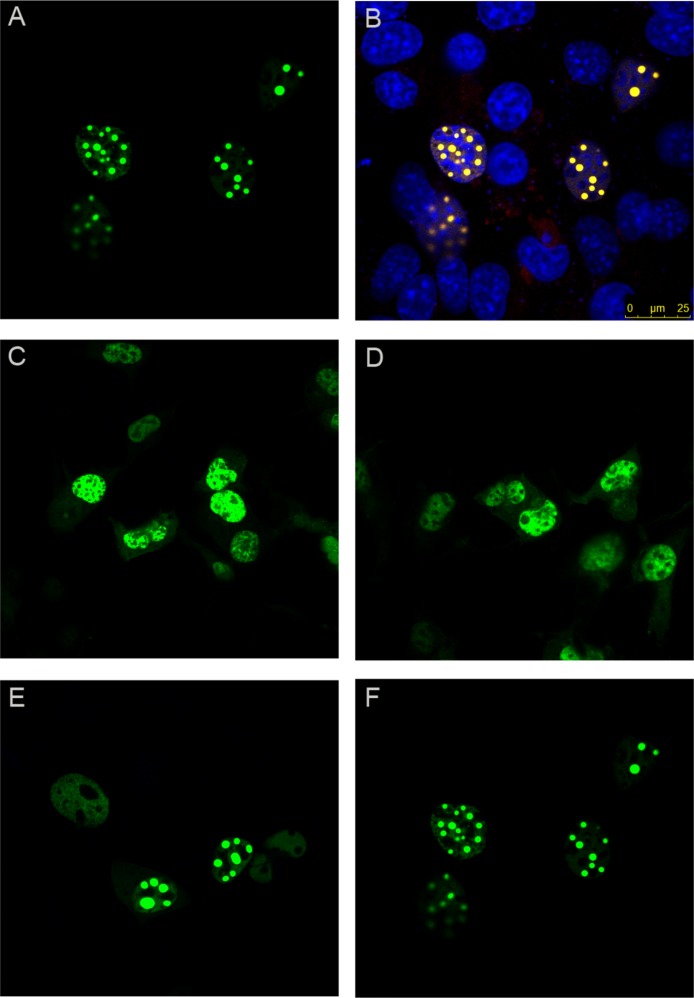
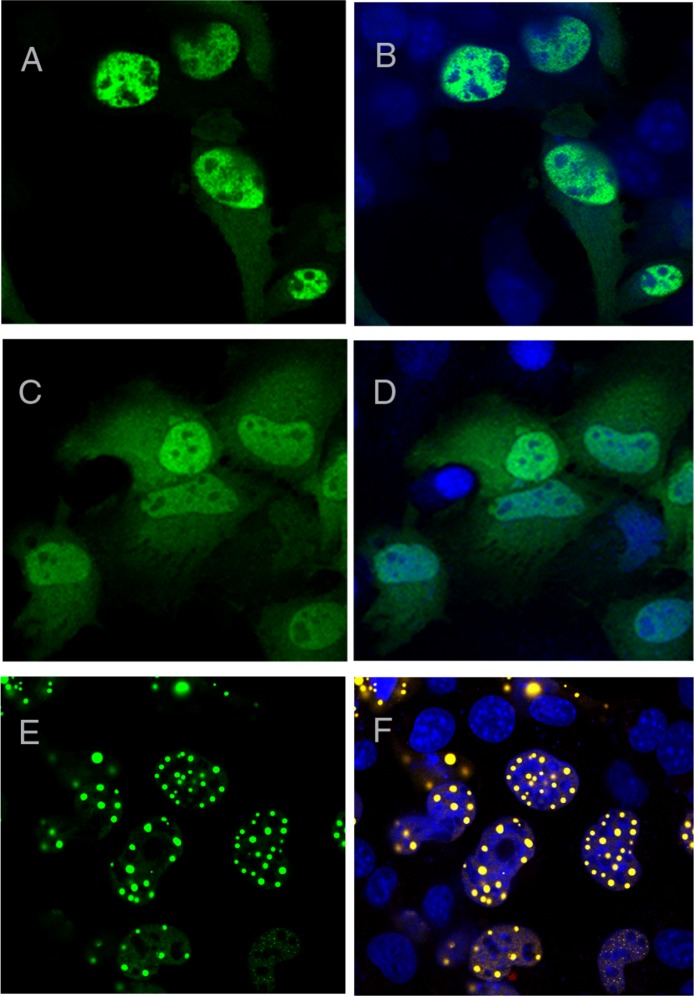
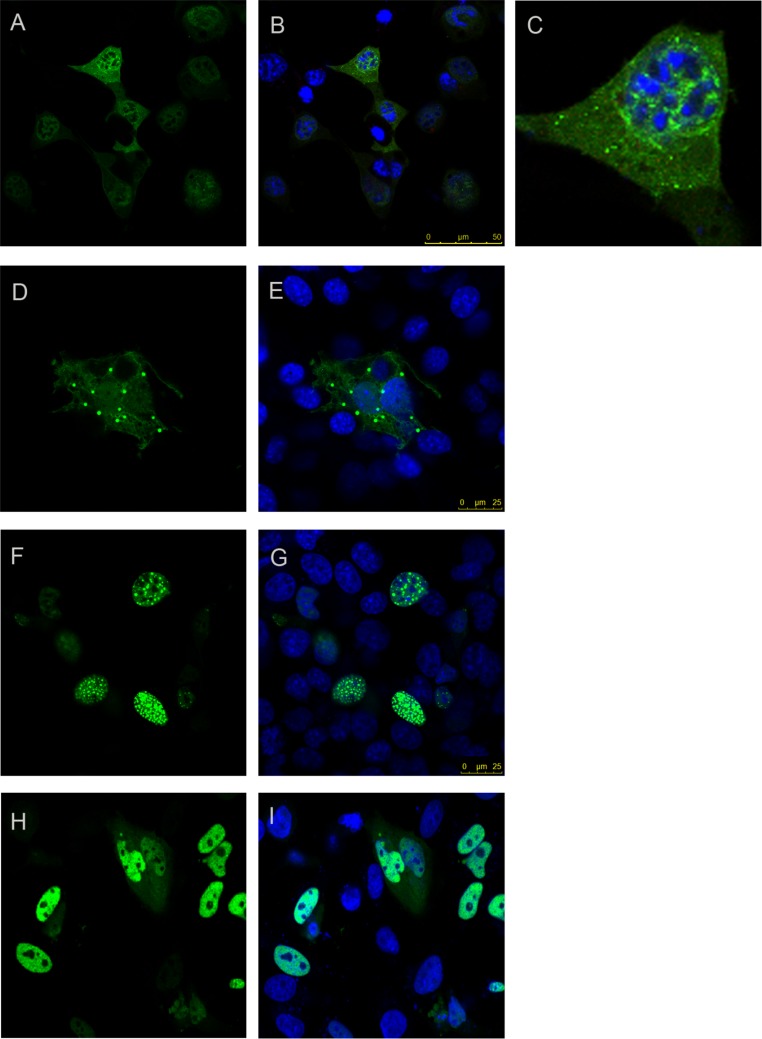
The neurodegenerative disease spinocerebellar ataxia type 1 (SCA1) is caused by aggregation and misfolding of the ataxin-1 protein. While the pathology correlates with mutations that lead to expansion of a polyglutamine tract in the protein, other regions contribute to the aggregation process as also non-expanded ataxin-1 is intrinsically aggregation-prone and forms nuclear foci in cell. Here, we have used a combined approach based on FRET analysis, confocal microscopy and in vitro techniques to map aggregation-prone regions other than polyglutamine and to establish the importance of dimerization in self-association/foci formation. Identification of aggregation-prone regions other than polyglutamine could greatly help the development of SCA1 treatment more specific than that based on targeting the low complexity polyglutamine region.
Keywords: Confocal microscopy; FRET; Foci; Misfolding diseases; Spinocerebellar ataxia type 1.
Figures
Similar articles
-
Progress in pathogenesis studies of spinocerebellar ataxia type 1.Philos Trans R Soc Lond B Biol Sci. 1999 Jun 29;354(1386):1079-81. doi: 10.1098/rstb.1999.0462. Philos Trans R Soc Lond B Biol Sci. 1999. PMID: 10434309 Free PMC article. Review.
-
Enhanced molecular mobility of ordinarily structured regions drives polyglutamine disease.J Biol Chem. 2015 Oct 2;290(40):24190-200. doi: 10.1074/jbc.M115.659532. Epub 2015 Aug 10. J Biol Chem. 2015. PMID: 26260925 Free PMC article.
-
Ataxin-1 nuclear localization and aggregation: role in polyglutamine-induced disease in SCA1 transgenic mice.Cell. 1998 Oct 2;95(1):41-53. doi: 10.1016/s0092-8674(00)81781-x. Cell. 1998. PMID: 9778246
-
Proteasome function is inhibited by polyglutamine-expanded ataxin-1, the SCA1 gene product.Mol Cells. 2005 Feb 28;19(1):23-30. Mol Cells. 2005. PMID: 15750336
-
Molecular pathogenesis of spinocerebellar ataxia type 1 disease.Mol Cells. 2009 Jun 30;27(6):621-7. doi: 10.1007/s10059-009-0095-y. Epub 2009 Jun 22. Mol Cells. 2009. PMID: 19572115 Review.
Cited by
-
Destabilizing the AXH Tetramer by Mutations: Mechanisms and Potential Antiaggregation Strategies.Biophys J. 2018 Jan 23;114(2):323-330. doi: 10.1016/j.bpj.2017.11.025. Biophys J. 2018. PMID: 29401430 Free PMC article.
-
Nuclear bodies formed by polyQ-ataxin-1 protein are liquid RNA/protein droplets with tunable dynamics.Sci Rep. 2020 Jan 31;10(1):1557. doi: 10.1038/s41598-020-57994-9. Sci Rep. 2020. PMID: 32005838 Free PMC article.
-
In vitro aggregating β-lactamase-polyQ chimeras do not induce toxic effects in an in vivo Caenorhabditis elegans model.J Negat Results Biomed. 2017 Aug 22;16(1):14. doi: 10.1186/s12952-017-0080-5. J Negat Results Biomed. 2017. PMID: 28830560 Free PMC article.
References
-
- Chen HK, Fernandez-Funez P, Acevedo SF, Lam YC, Kaytor MD, Fernandez MH, Aitken A, Skoulakis EM, Orr HT, Botas J, Zoghbi HY. Interaction of Akt-phosphorylated ataxin-1 with 14-3-3 mediates neurodegeneration in spinocerebellar ataxia type 1. Cell. 2003;113:457–468. doi: 10.1016/S0092-8674(03)00349-0. - DOI - PubMed
Grants and funding
LinkOut - more resources
Full Text Sources
Other Literature Sources
