

Bias, precision and statistical power of analysis of covariance in the analysis of randomized trials with baseline imbalance: a simulation study
- PMID: 24712304
- PMCID: PMC3986434
- DOI: 10.1186/1471-2288-14-49
Bias, precision and statistical power of analysis of covariance in the analysis of randomized trials with baseline imbalance: a simulation study
Abstract
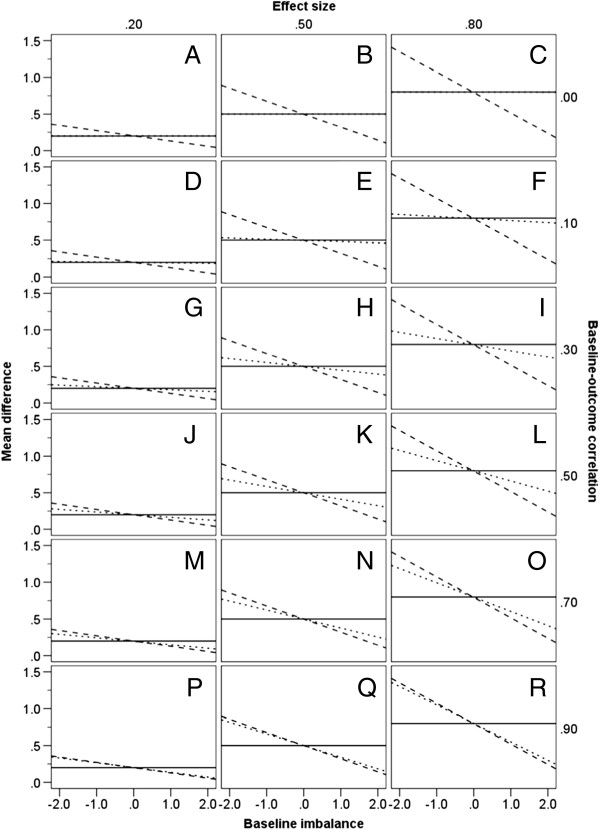
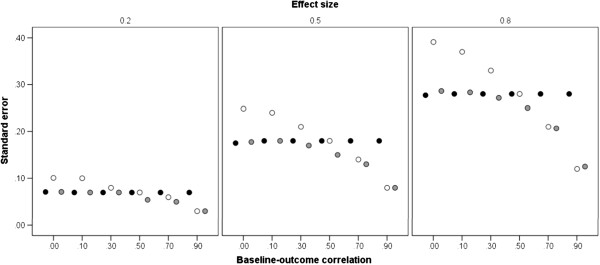
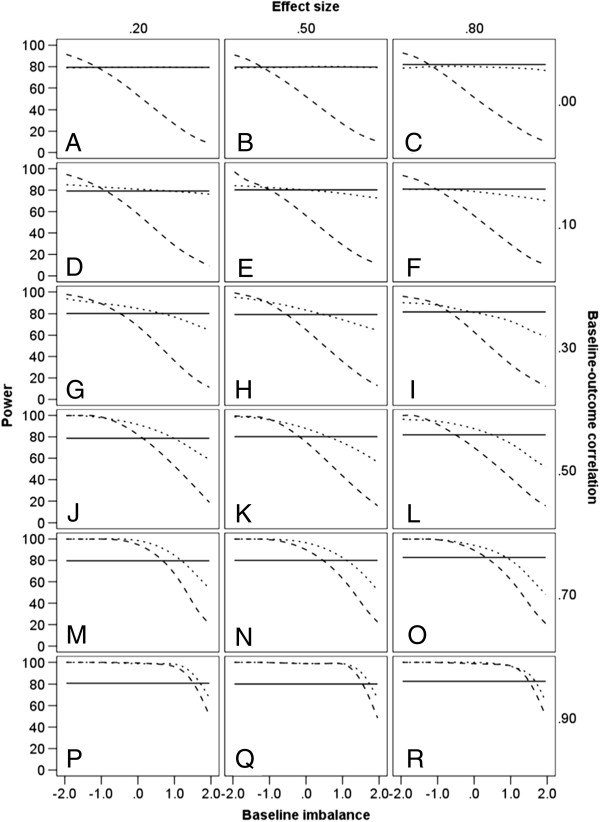
Background: Analysis of variance (ANOVA), change-score analysis (CSA) and analysis of covariance (ANCOVA) respond differently to baseline imbalance in randomized controlled trials. However, no empirical studies appear to have quantified the differential bias and precision of estimates derived from these methods of analysis, and their relative statistical power, in relation to combinations of levels of key trial characteristics. This simulation study therefore examined the relative bias, precision and statistical power of these three analyses using simulated trial data.
Methods: 126 hypothetical trial scenarios were evaluated (126,000 datasets), each with continuous data simulated by using a combination of levels of: treatment effect; pretest-posttest correlation; direction and magnitude of baseline imbalance. The bias, precision and power of each method of analysis were calculated for each scenario.
Results: Compared to the unbiased estimates produced by ANCOVA, both ANOVA and CSA are subject to bias, in relation to pretest-posttest correlation and the direction of baseline imbalance. Additionally, ANOVA and CSA are less precise than ANCOVA, especially when pretest-posttest correlation ≥ 0.3. When groups are balanced at baseline, ANCOVA is at least as powerful as the other analyses. Apparently greater power of ANOVA and CSA at certain imbalances is achieved in respect of a biased treatment effect.
Conclusions: Across a range of correlations between pre- and post-treatment scores and at varying levels and direction of baseline imbalance, ANCOVA remains the optimum statistical method for the analysis of continuous outcomes in RCTs, in terms of bias, precision and statistical power.
Figures
References
-
- Rosenberger WF, Lachin JM. Randomization in Clinical Trials: Theory and Practice. New York, NY: Wiley-Interscience; 2002.
-
- Altman DG, Doré CJ. Baseline comparisons in randomized clinical trials. Stat Med. 1991;10:797–799. - PubMed
-
- Tu D, Shalay K, Pater J. Adjustment of treatment effect for covariates in clinical trials: statistical and regulatory issues. Drug Inf J. 2000;34:511–523.
MeSH terms
LinkOut - more resources
Full Text Sources
Other Literature Sources
