Comparative Study
. 2014 Jun;26(6):874-84.
doi: 10.1111/nmo.12343. Epub 2014 Apr 8.

Appearance of cholinergic myenteric neurons during enteric nervous system development: comparison of different ChAT fluorescent mouse reporter lines

Affiliations
Comparative Study

Appearance of cholinergic myenteric neurons during enteric nervous system development: comparison of different ChAT fluorescent mouse reporter lines

C S Erickson et al. Neurogastroenterol Motil. 2014 Jun.

Abstract

Background: Cholinergic neurons have been identified with the acetylcholine synthetic enzyme choline acetyltransferase (ChAT). However, ChAT is difficult to localize in newly differentiated peripheral neurons making the study of cholinergic neuronal development problematic. Consequently, researchers have used mouse reporter lines to indicate the presence of ChAT.

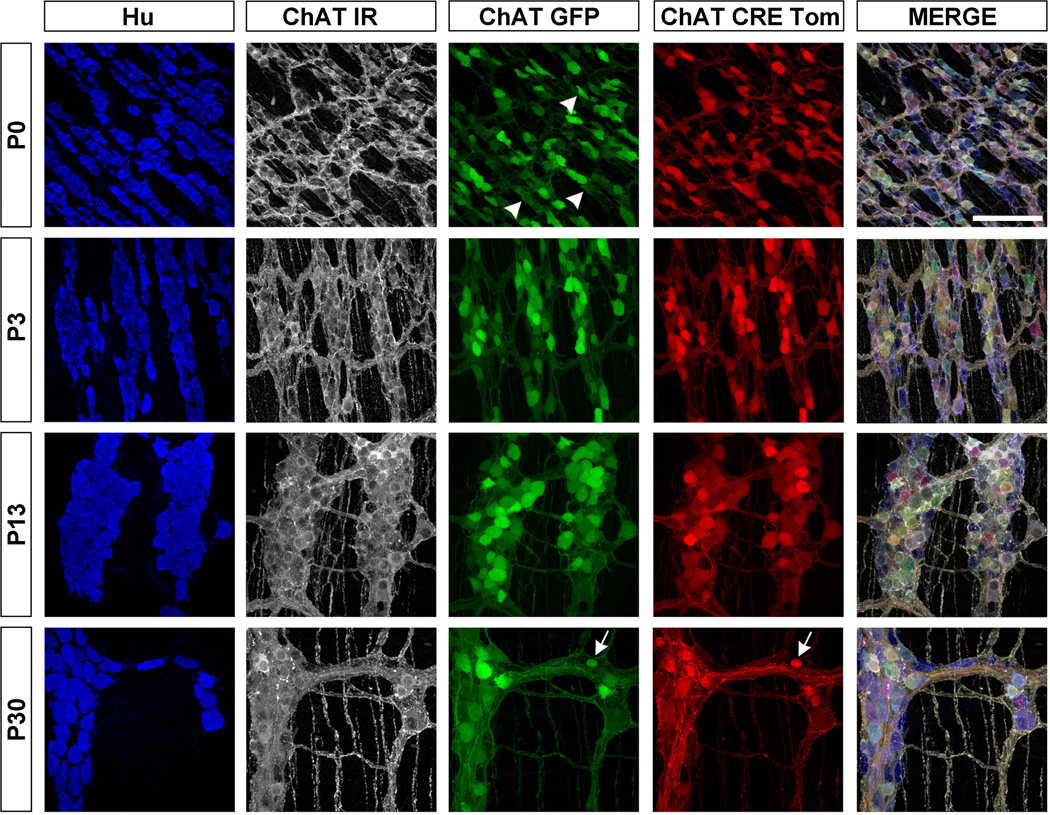
Methods: Our objective was to determine which ChAT reporter line was the most sensitive indicator of ChAT expression. We utilized two different fluorescent ChAT reporter lines (ChAT-GFP and ChAT-Cre;R26R:floxSTOP:tdTomato) together with immunolocalization of ChAT protein (ChAT-IR) to characterize the spatial and temporal expression of ChAT in myenteric neurons throughout enteric nervous system (ENS) development.

Key results: ChAT-IR cells were first seen in the intestine at E10.5, even within the migration wavefront of neural precursors. Myenteric neurons within the distal small intestine (dSI) and proximal colon were first labeled by ChAT-IR, then ChAT-GFP, and finally ChAT-Cre tdTomato. The percentage of ChAT-IR neurons is equivalent to adult levels in the dSI by E13.5 and proximal colon by P0. After these stages, the percentages remained relatively constant throughout development despite dramatic changes in neuronal density.

Conclusions & inferences: These observations indicate that neurotransmitter expression occurs early and there is only a brief gap between neurogenesis and neurotransmitter expression. Our finding that the proportion of ChAT myenteric neurons reached adult levels during embryonic development suggests that the fate of cholinergic neurons is tightly regulated and that their differentiation might influence further neuronal development. ChAT-GFP is a more accurate indicator of early ENS cholinergic neuronal differentiation than the ChAT-Cre;R26R:floxSTOP:tdTomato reporter mouse.

Keywords: ChAT; ChAT-Cre tdTomato; ChAT-GFP; cholinergic neurogenesis; enteric nervous system.


Figures

Figure 1
Figure 1
Representative images of cholinergic neurons in the pSI at E10.5 and E11.5 and the dSI at E13.5 and E16.5. At E10.5 a small number of Hu+ neurons (blue) were found in the pSI and the majority of them were labeled with ChAT-IR (white) and ChAT-GFP (green); however, none was ChAT-Cre tdTomato+ at this stage (red). In the E11.5 pSI, the number of Hu+ neurons had increased and most were ChAT-IR and ChAT-GFP while none expressed ChAT-Cre tdTomato. At E13.5 in the dSI, ChAT-IR and ChAT-GFP signal was more intense and co-localized. A small number of these cells also expressed ChAT-Cre tdTomato. The ChAT-IR, ChAT-GFP, and small number of ChAT-CRE tdTomato neurons were found in nascent ganglia at E16.5. Scale bar for E10.5 = 50µm, all other stages = 100µm.
Figure 2
Figure 2
Upper panel: Percentage of ChAT-IR neurons that were ChAT-GFP and ChAT-Cre tdTomato in the dSI and proximal colon. In the dSI, at E11.5 the majority of cholinergic neurons were only labeled with ChAT-IR, some of these were also ChAT-GFP positive, while none expressed ChAT-Cre tdTomato At E13.5, a larger percentage expressed GFP but still only a small number were ChAT-Cre tdTomato+. By E16.5 nearly all ChAT-IR neurons expressed ChAT-GFP and 14% were ChAT-Cre tdTomato+. Postnatally, virtually all ChAT-IR neurons expressed ChAT-GFP and the percentage with ChAT-Cre tdTomato increased until P13 when nearly all neurons co-expressed all three markers. Lower panel: The proximal colon showed a gradual increase in GFP expression in ChAT-IR neurons until P0 when nearly all were ChAT-GFP+. ChAT-CRE tdTomato expression was again delayed and did not reach maximal levels until P13).
Figure 3
Figure 3
Variation of ChAT-GFP and ChAT-Cre tdTomato expression along E13.5 SI. ChAT-GFP is observed in a proximal to distal gradient along the SI with more cells in the proximal than distal SI. The most rostral ChAT-GFP+ cell is found within the cecum (see white arrow). (Some background fluorescence can be seen distal to the cecum). Individual ChAT-Cre tdTomato cells are found in small numbers scattered uniformly along the SI. The most rostral ChAT-Cre tdTomato+ cell is coincident with the most rostral ChAT-GFP+ cells (see white arrow). The lower panel shows a merge of the upper images. Scale bar = 400µm.
Figure 4
Figure 4
Neuronal and cholinergic differentiation within the neural crest-derived migration wavefront. Hu+ neurons (blue) present within the migration wavefront of p75 positive (red) neural crest-derived cells expressed both ChAT-IR (white) and ChAT-GFP (green) in the SI at E10.5. In the colon at E13.5, the neural crest derived migration wavefront of p75+ cells contained neurons expressing only Hu and ChAT-IR since the most rostral ChAT-GFP+ cells was restricted to the SI at this stage. Scale bar = 50µm.
Figure 5
Figure 5
Representative images of cholinergic neurons in the distal SI from P0 to P30. At P0, the majority of ChAT-IR neurons (white) were ChAT-GFP+ (green) and many expressed ChAT-Cre tdTomato (red). Arrowheads indicate ChAT-GFP neurons that are negative for ChAT-Cre tdTomato+. By P13 and P30 nearly all of the ChAT-IR neurons expressed ChAT-Cre tdTomato. The fluorescence of a small percentage of ChAT-GFP and ChAT-Cre tdTomato neurons at P30 was restricted to the nucleus and lacked ChAT-IR (arrows). Scale bar = 100µm.
Figure 6
Figure 6
Neuronal density and gut length at different ages. A. Neuronal density of dSI increases from E11.5 to E16.5 and then declines with increasing age. Neuronal density in proximal colon is maintained at maximum values between E16.5-P3 but declines at P13 B. Neuronal density (left axis) plotted against SI length (right axis). C. Neuronal density (left axis) plotted against colon length (right axis).

References

    1. Sang Q, Young HM. The identification and chemical coding of cholinergic neurons in the small and large intestine of the mouse. The Anatomical record. 1998;251(2):185–199. - PubMed
    1. Sang Q, Young HM. Chemical coding of neurons in the myenteric plexus and external muscle of the small and large intestine of the mouse. Cell and tissue research. 1996;284(1):39–53. - PubMed
    1. Qu ZD, et al. Immunohistochemical analysis of neuron types in the mouse small intestine. Cell and tissue research. 2008;334(2):147–161. - PubMed
    1. Bian XC, Bornstein JC, Bertrand PP. Nicotinic transmission at functionally distinct synapses in descending reflex pathways of the rat colon. Neurogastroenterology and motility : the official journal of the European Gastrointestinal Motility Society. 2003;15(2):161–171. - PubMed
    1. Johnson CD, Epstein ML. Monoclonal antibodies and polyvalent antiserum to chicken choline acetyltransferase. Journal of neurochemistry. 1986;46(3):968–976. - PubMed

Publication types

MeSH terms

Substances

LinkOut - more resources