. 2014 Aug;177(2):439-53.
doi: 10.1111/cei.12343.

Treatment with lenalidomide induces immunoactivating and counter-regulatory immunosuppressive changes in myeloma patients

Affiliations

Treatment with lenalidomide induces immunoactivating and counter-regulatory immunosuppressive changes in myeloma patients

A Busch et al. Clin Exp Immunol. 2014 Aug.

Abstract

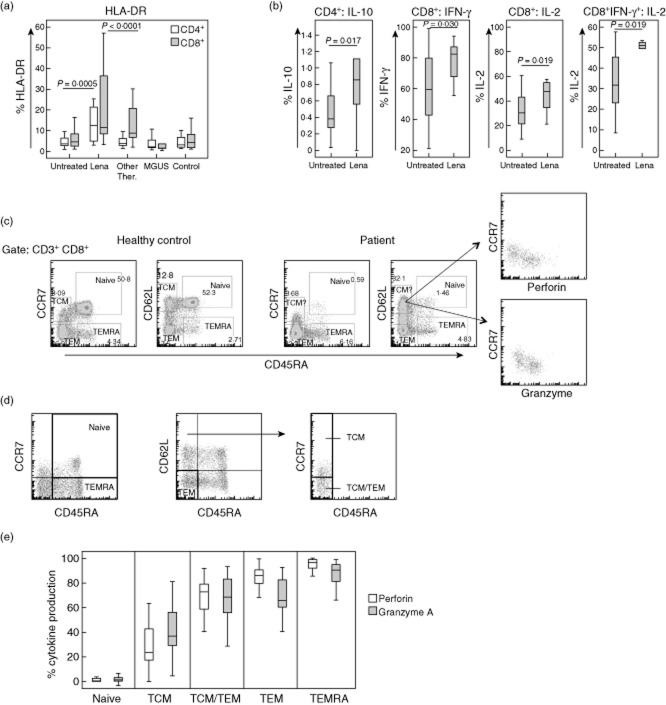
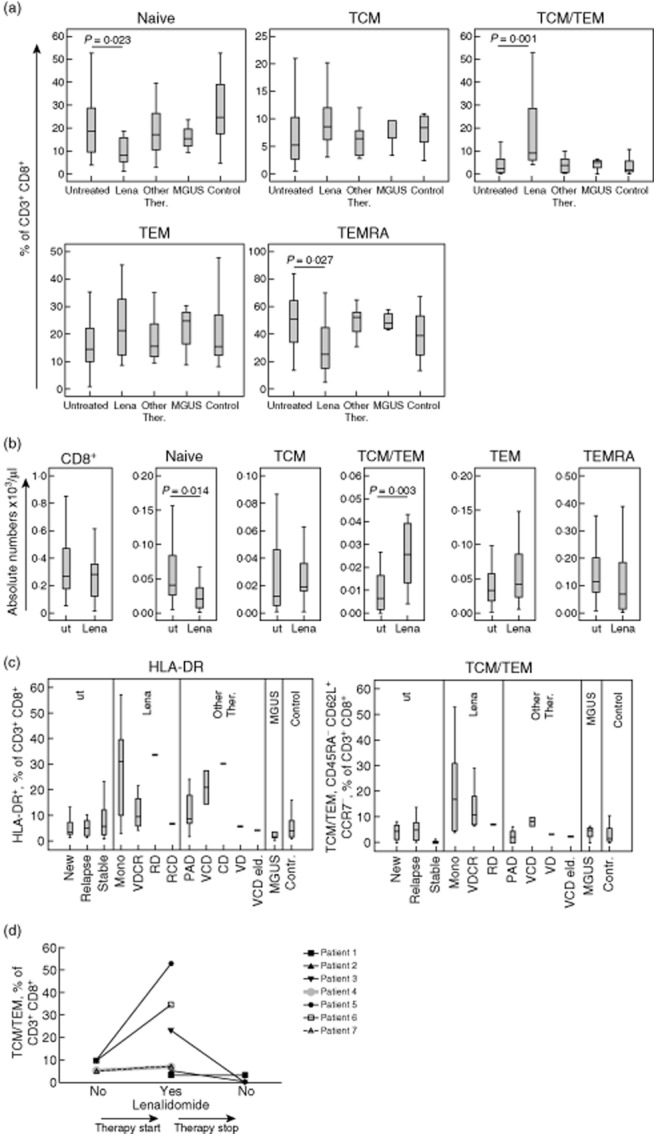
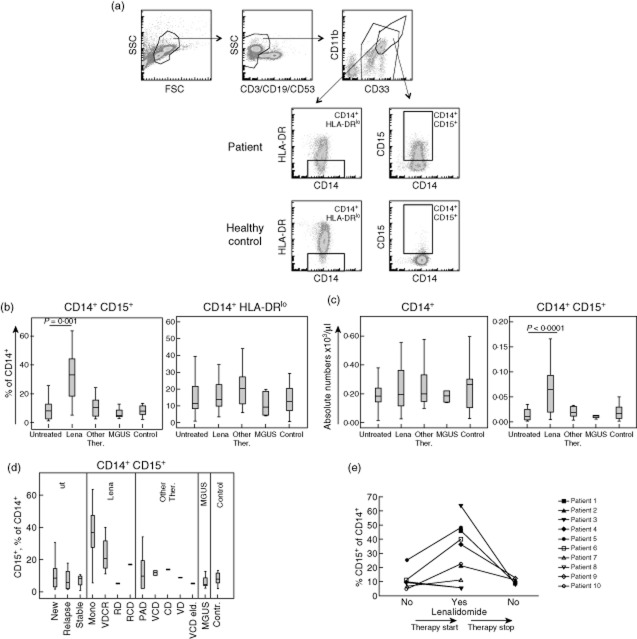
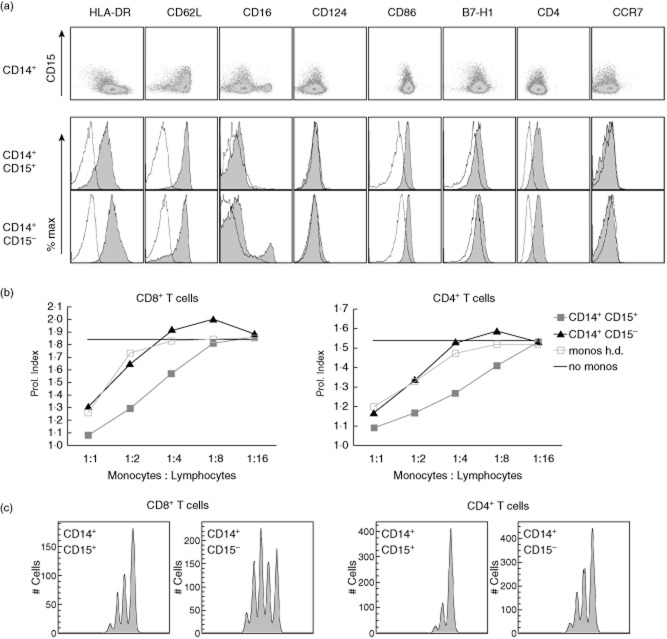
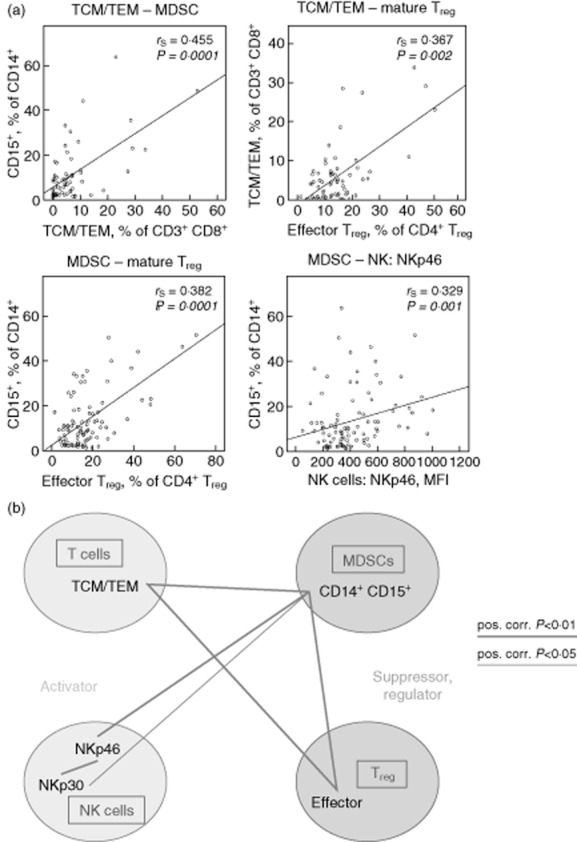
Lenalidomide activates the immune system, but the exact immunomodulatory mechanisms of lenalidomide in vivo are poorly defined. In an observational study we assessed the impact of lenalidomide on different populations of immune cells in multiple myeloma patients. Lenalidomide therapy was associated with increased amounts of a CD8(+) T cell subset, phenotypically staged between classical central memory T cells (TCM) and effector memory T cells (TEM), consequently termed TCM/TEM. The moderate expression of perforin/granzyme and phenotypical profile of these cells identifies them as not yet terminally differentiated, which makes them promising candidates for the anti-tumour response. In addition, lenalidomide-treated patients showed higher abundance of CD14(+) myeloid cells co-expressing CD15. This population was able to inhibit both CD4(+) and CD8(+) T cell proliferation in vitro and could thus be defined as a so far undescribed novel myeloid-derived suppressor cell (MDSC) subtype. We observed a striking correlation between levels of TCM/TEM, mature regulatory T cells (T(regs)) and CD14(+) CD15(+) MDSCs. In summary, lenalidomide induces both activating and inhibitory components of the immune system, indicating the existence of potential counter-regulatory mechanisms. These findings provide new insights into the immunomodulatory action of lenalidomide.

Keywords: MDSCs; T cells; immunoregulation; lenalidomide; multiple myeloma.


Figures

Fig. 1
Fig. 1
Identification of a novel central memory CD8+ T cell type. (a) Human leucocyte antigen D-related (HLA-DR) expression in peripheral blood CD4+ and CD8+ T cells. Cells analysed by flow cytometry and gated as CD45+CD3+CD4+/CD8+. Box-plots represent untreated multiple myeloma (MM) patients (n = 36), lenalidomide-treated patients (n = 17), patients treated by therapies excluding lenalidomide (n = 15), monoclonal gammopathy of uncertain significance (MGUS) (n = 5) and age-matched healthy controls (n = 24). Lenalidomide treatment significantly increased the frequency of HLA-DR+ T cells in patients (median CD4+ = 12·4%, CD8+ = 11·7%) compared to untreated MM patients (median CD4+ = 3·6%, CD8+ = 4·5%; CD4+ P = 2·54E-04, CD8+ P = 4·54E-05). (b) Cytokine expression in CD4+ and CD8+ T cells after phorbol myristate acetate (PMA)/ionomycin stimulation for 5 h. Lenalidomide treatment significantly increases interleukin (IL)-10 production by CD4+ T cells as well as interferon (IFN)-γ and IL-2 production by CD8+ T cells (median CD4+/IL-10+ = 0·38%, median CD8+/IFN-γ = 59%, median CD8+/IL-2+ = 30%) compared to untreated patients (median CD4+/IL-10+ = 0·82%, median CD8+/IFN-γ = 80%, median CD8+/IL-2+ = 48%; CD4+/IL-10+ P = 0·017, CD8+/IFN-γ P = 0·030, CD8+/IL-2 P = 0·019). Lenalidomide treatment also results in an increase of IL-2 production within the CD8+IFN-γ+ subset (untreated median = 32%, Lena median = 51%, P = 0·019). (c) Commonly used gating strategies for CD8+ T cell populations by plotting either CD45RA versus CCR7 or CD45RA versus CD62L. CD8+ T cell subsets are defined as naive (CD45RA+CCR7+CD62L+), central memory [central memory T cells (TCM), CD45RACCR7+CD62L+], effector [effector memory T cells (TEM), CD45RACCR7CD62L] and late effector memory RA [(TEMRA), CD45RA+CCR7CD62L]. Compared to healthy controls (left) we observed a proportion of CCR7 cells within the CD45RACD62L+ gate in MM patients (right) leading to divergent results for TCM defined by gating strategies employing CD45RA/CCR7 and CD45RACD62L (TCM?). The level of CCR7 expression in this T cell population is associated strongly with the level of perforin/granzyme expression (right). (d) Extended gating strategies for CD8+ T cell populations including two subsets of CD45RACD62L+ central memory cells differing in their CCR7 expression. (e) Perforin/granzyme expression in the five CD8+ T cell subsets as defined in (c). Freshly isolated peripheral blood mononuclear cells (PBMCs) from patients and healthy controls (n = 36) were stained with extracellular markers as in (d) and intracellularly for perforin and granzyme after fixation/permeabilization. Boxes depict the interquartile range (IQR), the line the median and the whiskers the 95% confidence interval (CI).
Fig. 2
Fig. 2
Central memory T cells (TCM)/ effector memory T cells (TEM) CD8+ T cells are elevated in multiple myeloma (MM) patients treated with lenalidomide. (a) Frequency of CD8+ T cell populations in the peripheral blood from untreated MM patients (n = 30), lenalidomide-treated MM (n = 14), MM treated by therapies excluding lenalidomide (n = 13), monoclonal gammopathy of uncertain significance (MGUS) (n = 4) and age-matched healthy controls (n = 15). Lenalidomide treatment significantly increased the frequency of CD8+CD45RACD62L+CCR7 TCM/TEM in MM patients (median untreated = 2·4%, median Lena = 9·0%; P = 0·001) at the expense of naive cells (median untreated = 18·8%, median Lena = 8·0%; P = 0·023) and late effector memory RA (TEMRA) (median untreated = 51%, median Lena = 25%; P = 0·027). (b) Significantly elevated absolute numbers of TCM/TEM in lenalidomide-treated compared to untreated MM patients (median untreated = 6·3/μl, median Lena = 25·6/μl; P = 0·003). Naive CD8+ populations were decreased in lenalidomide-treated patients compared to untreated patients (median untreated = 41·0/μl, median Lena = 20·7/μl; P = 0·014). (c) Human leucocyte antigen D-related (HLA-DR) expression on CD8+ T cells and TCM/TEM distribution among CD8+ T cells for all treatment plans. Box-plots for HLA-DR expression represent untreated MM patients (ut) including newly diagnosed (n = 16), relapsed (n = 12) and patients with stable disease (n = 10); lenalidomide-treated patients (Lena) including patients treated by lenalidomide monotherapy (n = 12), by bortezomib, dexamethasone, cyclophosphamide and lenalidomide (VDCR) (n = 4), by lenalidomide and dexamethasone (RD) (n = 1) and by lenalidomide, dexamethasone and cyclophosphamide (RCD) (n = 1); patients treated by other therapies excluding lenalidomide (other ther.) including bortezomib, adriamycin and dexamethasone (PAD) (n = 10), VCD (n = 3), cyclophosphamide and dexamethasone (CD) (n = 1), bortezomib and dexamethasone (VD) (n = 1) and bortezomib, cyclophosphamide and dexamethasone (VCD) for elderly patients (n = 1); MGUS patients (n = 4) and untreated healthy controls (n = 24). Box-plots for TCM/TEM frequency represent untreated MM patients (ut) including newly diagnosed (n = 12), relapsed (n = 9), and patients with stable disease (n = 6); lenalidomide-treated patients (Lena) including patients treated by lenalidomide monotherapy (n = 9), by VDCR (n = 3) and by RD (n = 1); patients treated by other therapies excluding lenalidomide (other ther.) including PAD (n = 6), VCD (n = 3), VD (n = 1) and VCD for elderly patients (n = 1); MGUS patients (n = 3) and untreated healthy controls (n = 15). Boxes depict the interquartile range (IQR), the line the median and the whiskers the 95% confidence interval (CI). (d) TCM/TEM frequencies during lenalidomide therapy: lenalidomide induction or therapy stop in single patients. Boxes depict the IQR, the line the median and the whiskers the 95% CI.
Fig. 3
Fig. 3
Identification of a novel myeloid-derived suppressor cell (MDSC) population. (a) Gating strategy for CD14+ MDSC populations. Examples are shown for cells from a multiple myeloma (MM) patient treated with lenalidomide and from an age-matched healthy control. (b) CD15 and human leucocyte antigen D-related (HLA-DR) expression in the CD14+ population of freshly isolated peripheral blood mononuclear cells (PBMCs). Box-plots represent untreated MM patients (n = 36), lenalidomide-treated patients (n = 17), patients treated by therapies excluding lenalidomide (n = 15), monoclonal gammopathy of uncertain significance (MGUS) (n = 5) and age-matched healthy controls (n = 24). Lenalidomide treatment significantly increased the frequency of the CD15+ population among CD14+ cells in patients (median = 33·2%) compared to untreated MM patients (median = 8·1%, P = 0·001). (c) Significantly elevated absolute numbers of CD14+CD15+ cells in lenalidomide-treated compared to untreated MM patients (median untreated = 11·0/μl, median Lena = 64·4/μl; P = 5·35E-05). (d) CD14+CD15+ cell frequency among CD14+ monocytic cells for all treatment plans. Box-plots represent untreated MM patients (ut) including newly diagnosed (n = 16), relapsed (n = 12), and patients with stable disease (n = 10); lenalidomide-treated patients (Lena) including patients treated by lenalidomide monotherapy (n = 12), by bortezomib, dexamethasone, cyclophosphamide and lenalidomide (VDCR) (n = 4), by lenalidomide and dexamethasone (RD) (n = 1) and by lenalidomide, dexamethasone and cyclophosphamide (RCD) (n = 1); patients treated by other therapies excluding lenalidomide (other ther.) including bortezomib, adriamycin and dexamethasone (PAD) (n = 10), bortezomib, cyclophosphamide and dexamethasone (VCD) (n = 3), cyclophosphamide and dexamethasone (CD) (n = 1), VD (n = 1) and VCD for elderly patients (n = 1); monoclonal gammopathy of uncertain significance (MGUS) patients (n = 4) and untreated healthy controls (n = 24). Boxes depict the interquartile range (IQR), the line the median and the whiskers the 95% CI. (e) CD14+CD15+ frequencies during lenalidomide therapy in single patients. Boxes depict the interquartile range (IQR), the line the median and the whiskers the 95% confidence interval (CI).
Fig. 4
Fig. 4
Phenotypical and functional characterization of CD15+CD14+ myeloid cells. (a) Expression of various surface antigens by CD14+CD15+ cells. Upper dot-plots are gated on CD14+ cells, lower histograms represent CD14+CD15+ and CD14+CD15 cells, respectively. Stainings were performed for four donors with similar results; shaded histograms depict indicated markers, solid lines depict matching isotype controls. Representative phenotypes are shown. (b) Inhibition of CD8+ (right) and CD4+ (left) T cell proliferation by CD14+CD15+ myeloid-derived suppressor cells (MDSCs). T cells were carboxyfluorescein diacetate succinimidyl ester (CFSE)-stained and stimulated with anti CD3/CD2/CD28 beads and co-cultured with the indicated CD14+ populations at the indicated ratios. Data from one experiment out of three with similar results are shown. (c) Histograms for the plots shown in (b).
Fig. 5
Fig. 5
Correlations between various cell populations induced by lenalidomide treatment. (a) Correlations between central memory T cells (TCM)/effector memory T cells (TEM), effector regulatory T cell (Treg), CD14+CD15+ myeloid-derived suppressor cell (MDSC) and NKp46 expression in natural killer (NK) cells were evaluated using the non-parametric Spearman's rank test; Spearman's correlation coefficients (rs) and P-values are indicated in each scatterplot. Linear regression is shown as a solid line. (b) Schematic display of populations induced by lenalidomide treatment and their relationship.

Similar articles

Cited by

References

    1. Kyle RA, Rajkumar SV. Multiple myeloma. Blood. 2008;111:2962–2972. - PMC - PubMed
    1. Cook G, Campbell JD, Carr CE, Boyd KS, Franklin IM. Transforming growth factor beta from multiple myeloma cells inhibits proliferation and IL-2 responsiveness in T lymphocytes. J Leukoc Biol. 1999;66:981–988. - PubMed
    1. Liu J, Hamrouni A, Wolowiec D, et al. Plasma cells from multiple myeloma patients express B7-H1 (PD-L1) and increase expression after stimulation with IFN-{gamma} and TLR ligands via a MyD88-, TRAF6-, and MEK-dependent pathway. Blood. 2007;110:296–304. - PubMed
    1. Brown RD, Pope B, Murray A, et al. Dendritic cells from patients with myeloma are numerically normal but functionally defective as they fail to up-regulate CD80 (B7-1) expression after huCD40LT stimulation because of inhibition by transforming growth factor-beta1 and interleukin-10. Blood. 2001;98:2992–2998. - PubMed
    1. Wang S, Yang J, Qian J, Wezeman M, Kwak LW, Yi Q. Tumor evasion of the immune system: inhibiting p38 MAPK signaling restores the function of dendritic cells in multiple myeloma. Blood. 2006;107:2432–2439. - PMC - PubMed

Publication types

MeSH terms