. 2014 Apr;39(7):1148-58.
doi: 10.1111/ejn.12494.

Casein kinase 2 phosphorylates GluA1 and regulates its surface expression

Affiliations

Casein kinase 2 phosphorylates GluA1 and regulates its surface expression

Marc P Lussier et al. Eur J Neurosci. 2014 Apr.

Abstract

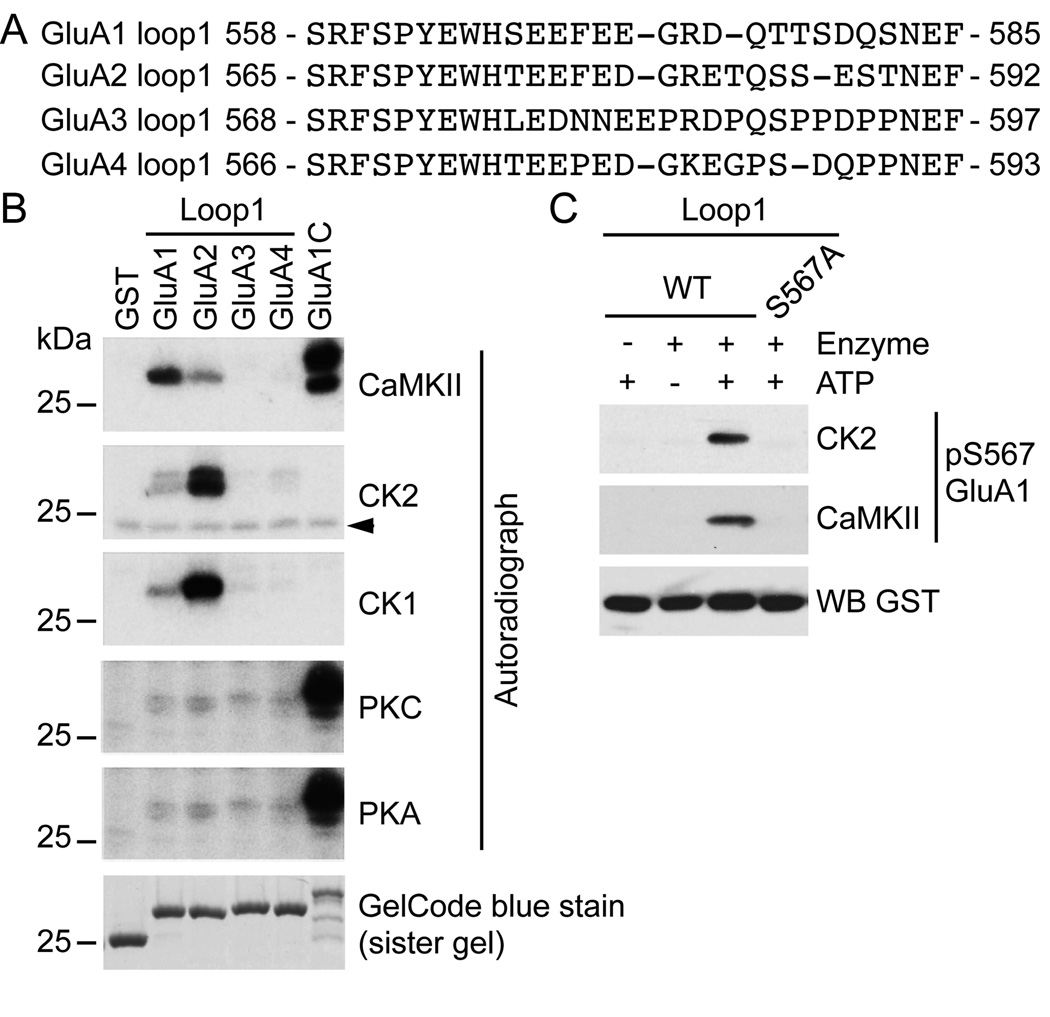
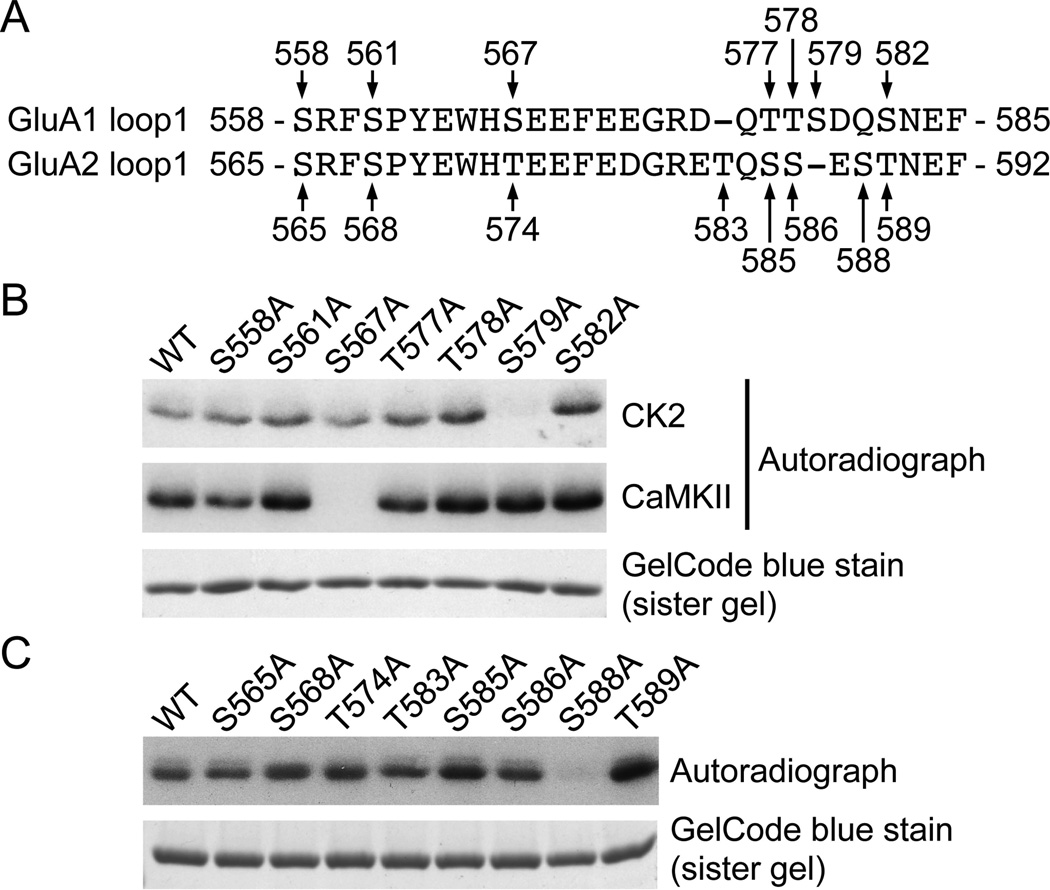
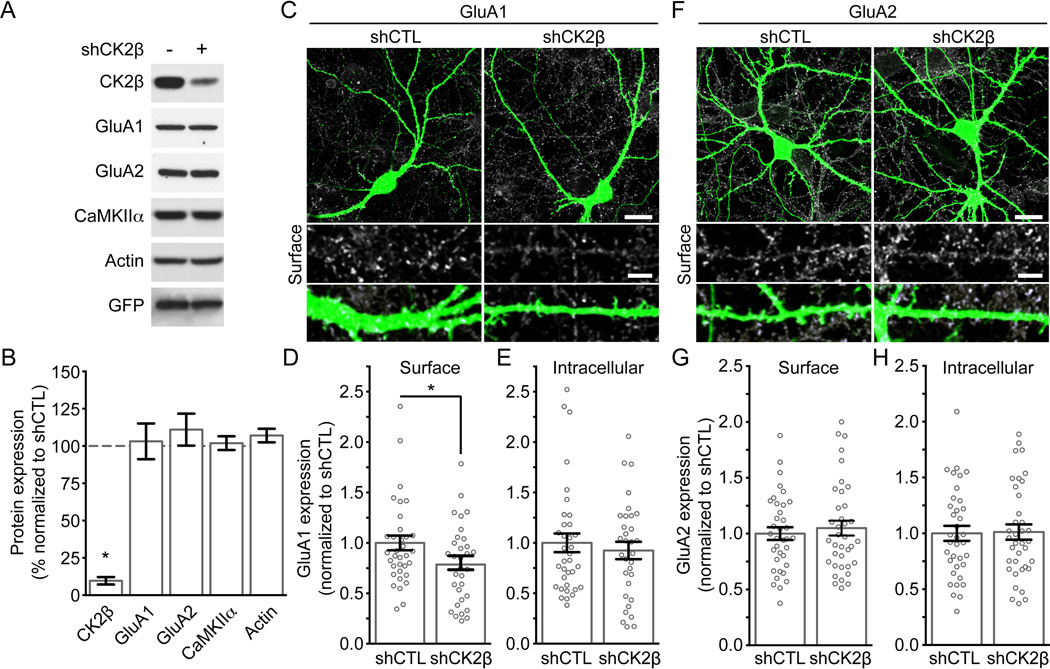
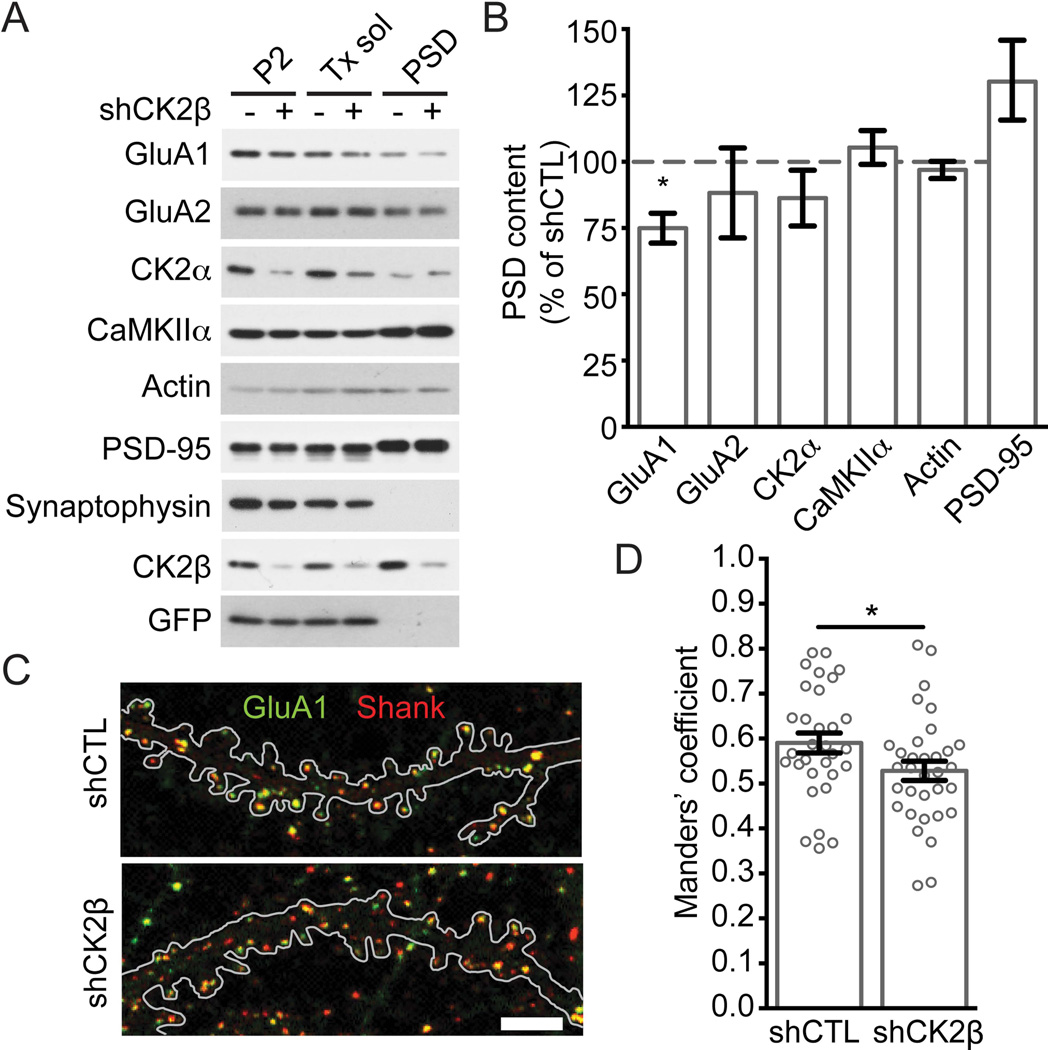
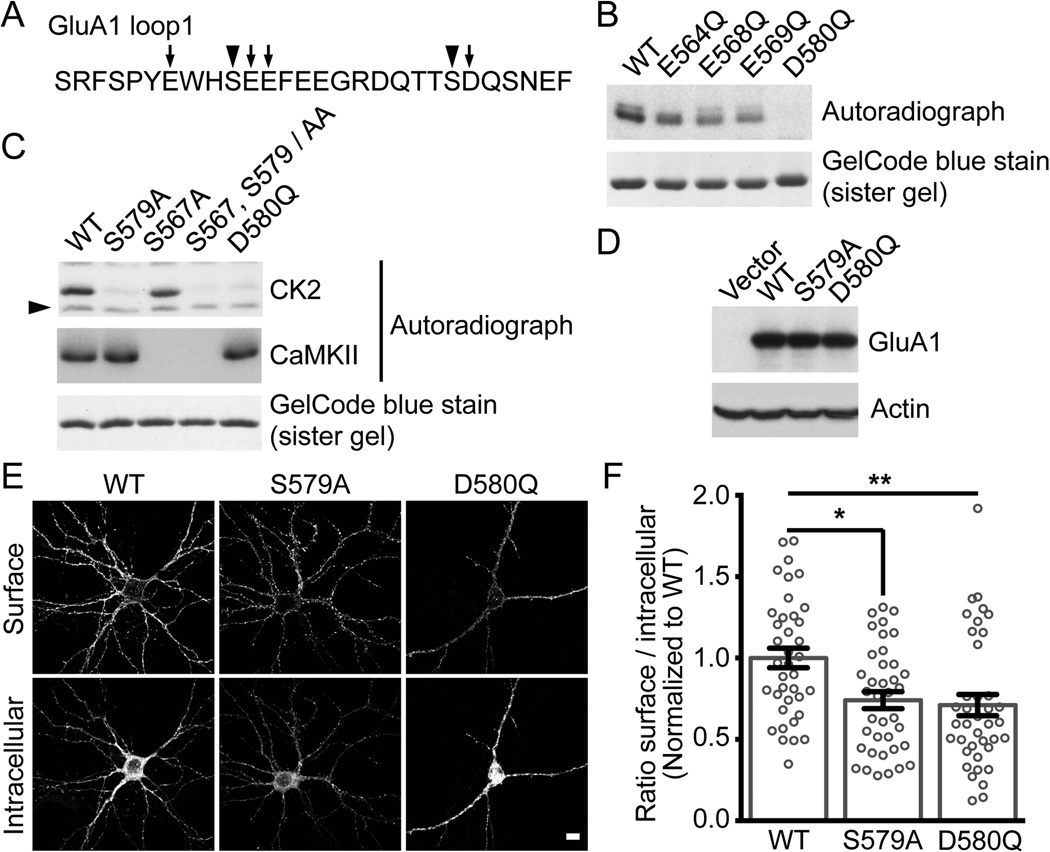
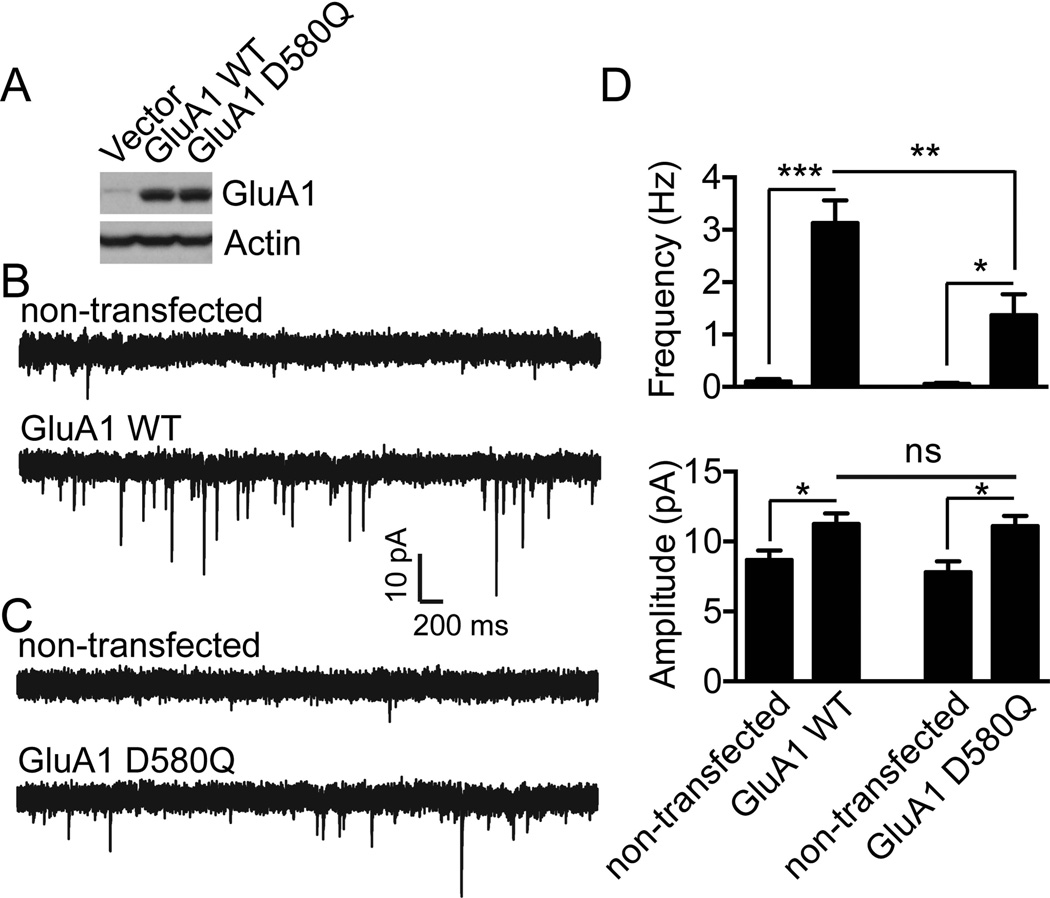
Controlling the density of α-amino-3-hydroxy-5-methyl-4-isoxazolepropionic acid receptors (AMPARs) at synapses is essential for regulating the strength of excitatory neurotransmission. In particular, the phosphorylation of AMPARs is important for defining both synaptic expression and intracellular routing of receptors. Phosphorylation is a post-translational modification known to regulate many cellular events and the C-termini of glutamate receptors are important targets. Recently, the first intracellular loop1 region of the GluA1 subunit of AMPARs was reported to regulate synaptic targeting through phosphorylation of S567 by Ca2+ /calmodulin-dependent protein kinase II (CaMKII). Intriguingly, the loop1 region of all four AMPAR subunits contains many putative phosphorylation sites (S/T/Y), leaving the possibility that other kinases may regulate AMPAR surface expression via phosphorylation of the loop regions. To explore this hypothesis, we used in vitro phosphorylation assays with a small panel of purified kinases and found that casein kinase 2 (CK2) phosphorylates the GluA1 and GluA2 loop1 regions, but not GluA3 or GluA4. Interestingly, when we reduced the endogenous expression of CK2 using a specific short hairpin RNA against the regulatory subunit CK2β, we detected a reduction of GluA1 surface expression, whereas GluA2 was unchanged. Furthermore, we identified S579 of GluA1 as a substrate of CK2, and the expression of GluA1 phosphodeficient mutants in hippocampal neurons displayed reduced surface expression. Therefore, our study identifies CK2 as a regulator of GluA1 surface expression by phosphorylating the intracellular loop1 region.

Keywords: AMPAR; CK2; glutamate; synapse; trafficking.


Conflict of interest statement

All the authors declare no conflict of interest.

Figures

Figure 1
Figure 1. Phosphorylation of the intracellular loop1 region of AMPARs by a variety of kinases
A) Sequence alignment of the intracellular loop1 region of the AMPAR subunits GluA1–4. B) GST, GST-fusion proteins of the loop1 region or the C-terminus of GluA1 were incubated with the indicated kinase and [γ-32P]-ATP, and analyzed by autoradiography. GelCode blue staining shows the amount of protein used for the assays. A typical result for each condition is shown. The arrowhead in (B) represents a non-specific band. C) As revealed by a phospho-specific immunoblot, purified GST-fusion protein of GluA1 loop1 is in vitro phosphorylated by CK2 and CaMKII on S567. An immunoblot against GST demonstrates that similar amount of protein was used for each condition. The specificity of our phospho-specific antibody against GluA1 pS567 for both CK2 and CaMKII is demonstrated, as GluA1 S567A shows no immunoreactivity.
Figure 2
Figure 2. Identification of the CK2 phosphorylation sites in the loop1 region of GluA1 and GluA2
A) Sequence alignment of the GluA1 and GluA2 intracellular loop1 residues. Arrows identify each of the serine and threonine residues in GST-GluA1 or GST-GluA2 loop1 mutated to alanine. B) GST-GluA1 loop1 fusion proteins were incubated with CK2 or CaMKII and [γ-32P]-ATP, and analyzed by autoradiography. C) GST-GluA2 loop1 fusion proteins were incubated with CK2 and [γ-32P]-ATP, and analyzed by autoradiography. GelCode blue staining shows the amount of GST-fusion protein used for an assay in (B) and (D). A typical result for each condition is shown.
Figure 3
Figure 3. A reduction of CK2 expression in cultured hippocampal neurons decreases surface expression of GluA1, but not GluA2
A) Lysates from cultured neurons transduced with shCTL or shCK2β lentiviruses were prepared and immunoblotted with specific antibodies as indicated. B) Bar graph of protein expression in (A) presented as mean ± SEM and * P < 0.0001 using unpaired t-test. Data obtained from at least 4 experiments. C–H) Hippocampal neurons transfected with shCTL or shCK2β were stained live for endogenous surface GluA1 (C–D) or GluA2 (F–G) under non-permeabilized conditions before being examined by confocal microscopy. Representative images show AMPAR surface expression and EGFP from a transfected neuron. Scale bar represents 20 µm. At higher magnification, the scale bar represents 5 µm. C–H) Quantitation of AMPAR expression. Bar graph is presented as mean ± SEM. The scatter plots represent the distribution of each cells analyzed and show that shCK2β, but not shCTL, reduces surface expression of GluA1 (C) but not GluA2 (E) without affecting total expression of GluA1 (E) or GluA2 (H). Images not shown for (E) and (H) Each group contain 32–37 cells from 4 independent experiments (* P < 0.05 using unpaired t-test).
Figure 4
Figure 4. Reduced CK2 expression in cultured neurons decreases GluA1 in the synaptic fraction
A) Subcellular fractionation was performed on cultured cortical neurons transduced with shCTL or shCK2β lentiviruses. Samples were prepared as described under Materials and Methods, and immunoblotted with specific antibodies as indicated. B) Quantitation of proteins found in the PSD / pellet fraction in (A). Bar graph shows that shCK2β but not shCTL decreases the expression of GluA1 and is presented as mean ± SEM. Quantitation performed from 6 experiments (*P < 0.05 for GluA1 using unpaired t-test). C–D) Hippocampal neurons transfected with shCTL or shCK2β were stained for endogenous total GluA1 (green) and Shank (red) before being examined by confocal microscopy. C) Representative images are shown, and the outline of the EGFP signal from a transfected neuron is depicted. Scale bar represents 5 µm. D) Quantitation of overlap between Shank and GluA1. Bar graph is presented as mean ± SEM while the scatter plot represents the distribution of each cells analyzed. Each group contains 31–33 cells from 5 independent experiments (* P < 0.05 using unpaired t-test).
Figure 5
Figure 5. Disruption of CK2 phosphorylation of GluA1 decreases surface expression
A) Amino acid sequence of GluA1 intracellular loop1. Arrowheads identify residues S567 and S579 that are phosphorylated by CK2 (Fig.1 B, C and 2B) and mutated to alanine in (C), while arrows indicate acidic residues in GluA1 loop1 mutated to glutamine (B–C). B–C) GST-GluA1 loop1 was incubated with CK2 or CaMKII and [γ-32P]-ATP, and analyzed by autoradiography. A typical assay is shown. The arrowhead in (C) represents a non-specific band, and a similar pattern was also observed in Fig. 1B. D) Lysates from HEK293T cells expressing Flag-GluA1 WT, S579A or D580Q molecular replacement constructs in pRK5 vector were immunoblotted with specific antibodies as indicated. Typical result is shown. E) Hippocampal neurons were transduced with GluA1 specific shRNA lentiviruses, transfected with Flag-GluA1 WT, S579A or D580Q molecular replacement constructs, stained under non-permeabilized (surface) and permeabilized (intracellular) conditions. The expression of Flag-GluA1 was assessed by confocal microscopy. Representative images show AMPAR surface and intracellular / total expression from transfected neurons. Scale bar represents 10 µm. F) Quantitation of Flag-GluA1 WT, S579A and D580Q in (E) and performed as described in Material and Methods. Bar graph is presented as mean ± SEM while the scatter plot represents the distribution of each cells analyzed (each group contains 38–39 cells from 3 independent experiments, * P < 0.05 and ** P < 0.01 using Kruskal-Wallis one-way ANOVA with Dunn’s multiple comparison test).
Figure 6
Figure 6. Disruption of GluA1 phosphorylation by CK2 impairs GluA1 synaptic targeting
A) Lysates from HEK293T cells expressing Flag-GluA1 WT or D580Q constructs in pIRES2-EGFP vector were prepared and immunoblotted with specific antibodies as indicated. Typical result is shown. B–C) Dissociated hippocampal cultures from GluA1 knockout mice were transfected with GluA1 WT (B) or with CK2 phospho-deficient mutant (GluA1 D580Q) (C). Whole-cell voltage clamp recordings to measure miniature EPSCs (mEPSCs) were performed after transfection. As shown in (D), although both GluA1 WT and GluA1 D580Q expression enhanced mEPSC frequency and amplitude, mEPSC frequency in neurons transfected with GluA1 WT was significantly higher than that in neurons transfected with GluA1 D580Q (for GluA1 WT, n = 9 for non-transfected and GluA1 WT transfected neurons; for GluA1 D580Q, n = 6 for non-transfected control and n = 10 for GluA1 D580Q). Error bars represent S.E.M. *P < 0.05, **P < 0.01, *** P < 0.001.

References

    1. Aksenova MV, Burbaeva GS, Kandror KV, Kapkov DV, Stepanov AS. The decreased level of casein kinase 2 in brain cortex of schizophrenic and Alzheimer’s disease patient. FEBS Lett. 1991;279:55–57. - PubMed
    1. Banke TG, Bowie D, Lee H, Huganir RL, Schousboe A, Traynelis SF. Control of GluR1 AMPA receptor function by cAMP-dependent protein kinase. J. Neurosci. 2000;20:89–102. - PMC - PubMed
    1. Barria A, Derkach V, Soderling T. Identification of the Ca2+/calmodulin-dependent protein kinase II regulatory phosphorylation site in the alpha-amino-3-hydroxyl-5-methyl-4-isoxazole-propionate-type glutamate receptor. J. Biol. Chem. 1997;272:32727–32730. - PubMed
    1. Bellone C, Nicoll RA. Rapid bidirectional switching of synaptic NMDA receptors. Neuron. 2007;55:779–785. - PubMed
    1. Belmeguenai A, Hosy E, Bengtsson F, Pedroarena CM, Piochon C, Teuling E, He Q, Ohtsuki G, De Jeu MT, Elgersma Y, De Zeeuw CI, Jörntell H, Hansel C. Intrinsic plasticity complements long-term potentiation in parallel fiber input gain control in cerebellar Purkinje cells. J. Neurosci. 2010;30:13630–13643. - PMC - PubMed

Publication types

MeSH terms

Substances