

The modifying effect of the building envelope on population exposure to PM2.5 from outdoor sources
- PMID: 24713025
- PMCID: PMC4278446
- DOI: 10.1111/ina.12116
The modifying effect of the building envelope on population exposure to PM2.5 from outdoor sources
Abstract
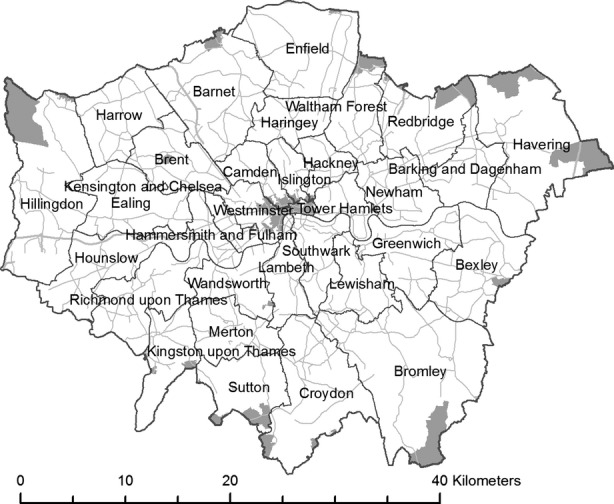
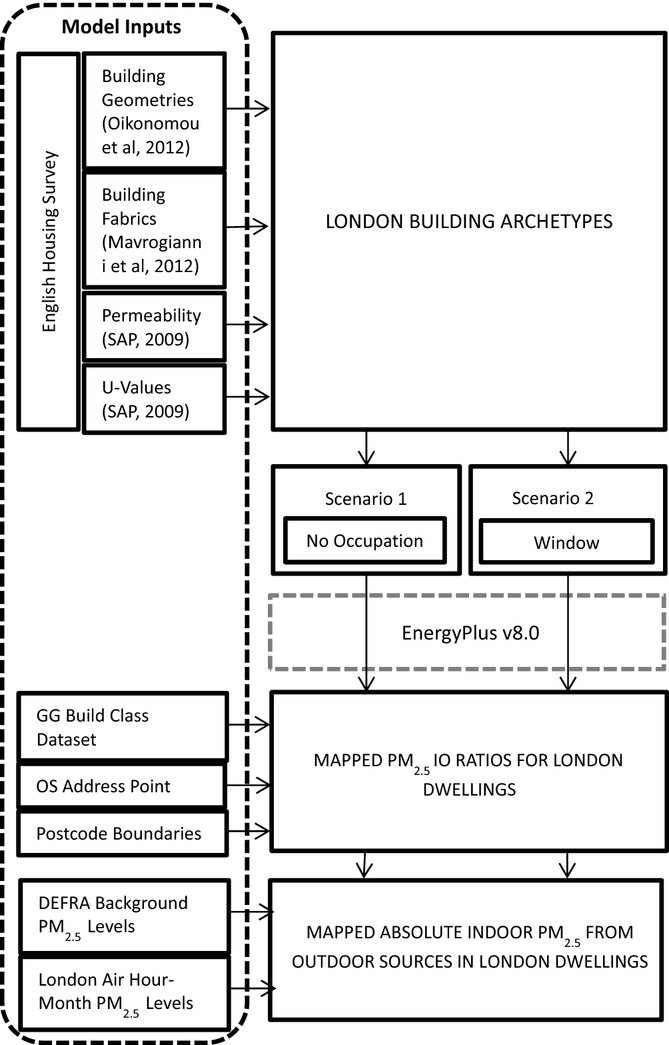
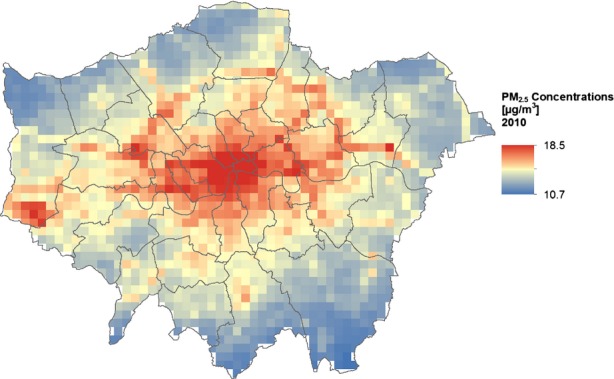
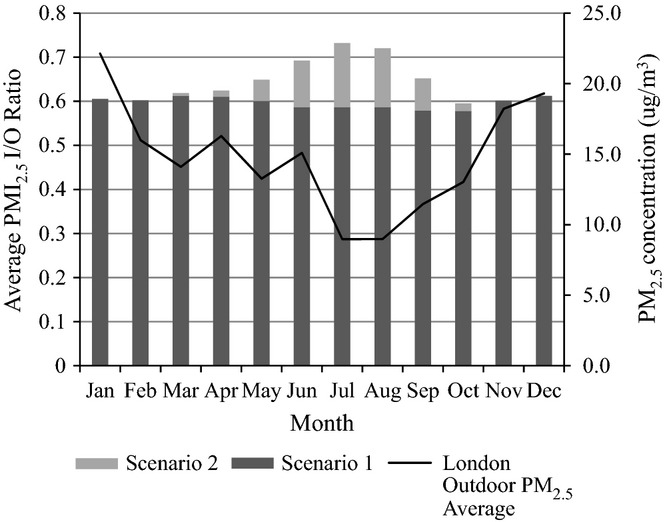
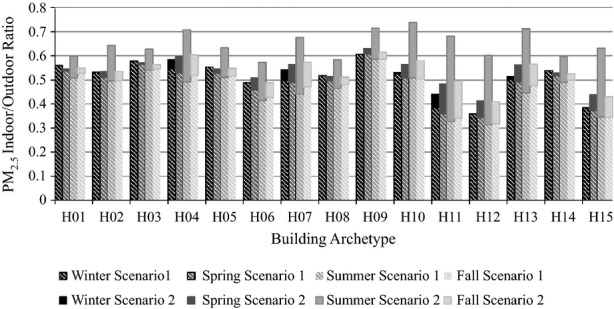
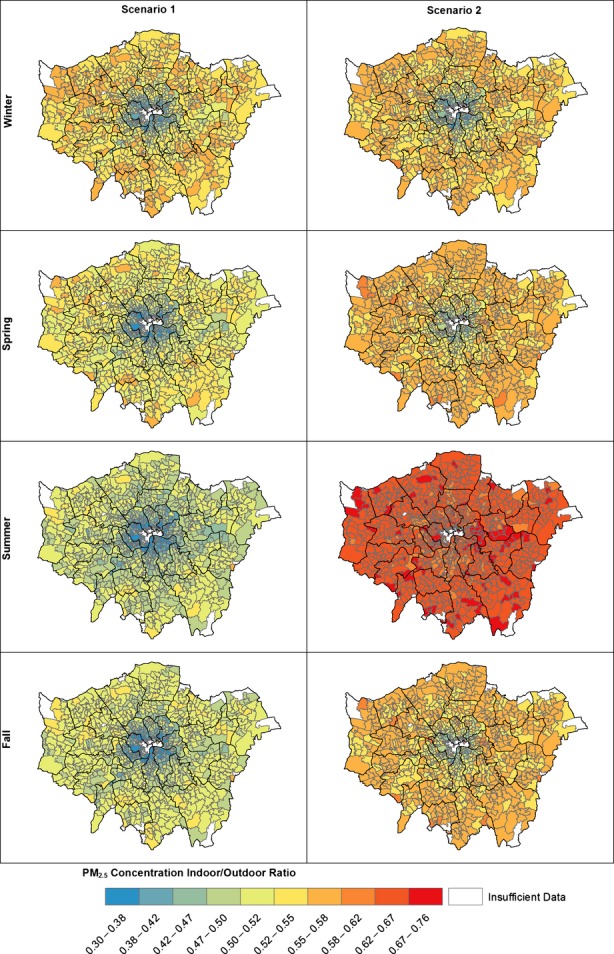
A number of studies have estimated population exposure to PM2.5 by examining modeled or measured outdoor PM2.5 levels. However, few have taken into account the mediating effects of building characteristics on the ingress of PM2.5 from outdoor sources and its impact on population exposure in the indoor domestic environment. This study describes how building simulation can be used to determine the indoor concentration of outdoor-sourced pollution for different housing typologies and how the results can be mapped using building stock models and Geographical Information Systems software to demonstrate the modifying effect of dwellings on occupant exposure to PM2.5 across London. Building archetypes broadly representative of those in the Greater London Authority were simulated for pollution infiltration using EnergyPlus. In addition, the influence of occupant behavior on indoor levels of PM2.5 from outdoor sources was examined using a temperature-dependent window-opening scenario. Results demonstrate a range of I/O ratios of PM2.5 , with detached and semi-detached dwellings most vulnerable to high levels of infiltration. When the results are mapped, central London shows lower I/O ratios of PM2.5 compared with outer London, an apparent inversion of exposure most likely caused by the prevalence of flats rather than detached or semi-detached properties.
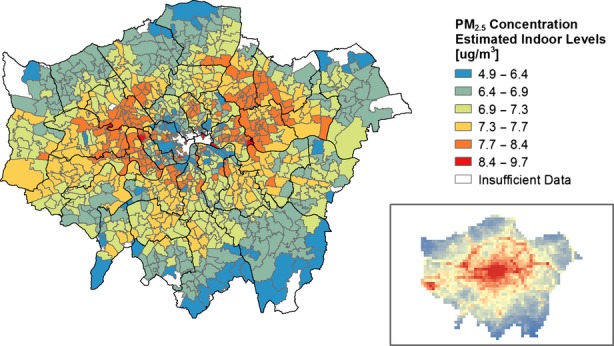
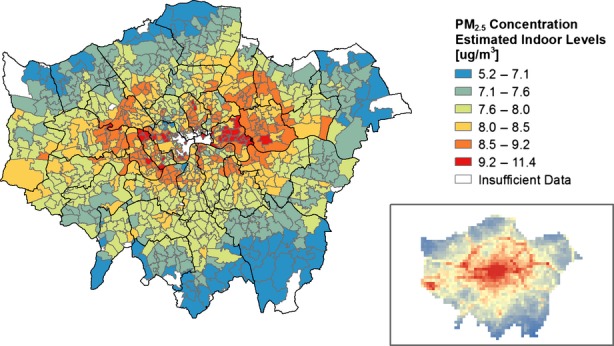
Practical implications: Population exposure to air pollution is typically evaluated using the outdoor concentration of pollutants and does not account for the fact that people in London spend over 80% of their time indoors. In this article, building simulation is used to model the infiltration of outdoor PM2.5 into the domestic indoor environment for dwellings in a London building stock model, and the results mapped. The results show the variation in relative vulnerability of dwellings to pollution infiltration, as well as an estimated absolute indoor concentration across the Greater London Authority (GLA) scaled by local outdoor levels. The practical application of this work is a better understanding of the modifying effect of the building geometry and envelope design on pollution exposure, and how the London building stock may alter exposure. The results will be used to inform population exposure to PM2.5 in future environmental epidemiological studies.
Keywords: Building stock model; EnergyPlus; Geographical information systems; Indoor air quality; PM 2.5.
© 2014 The Authors. Indoor Air Published by John Wiley & Sons Ltd.
Figures
Similar articles
-
Application of an indoor air pollution metamodel to a spatially-distributed housing stock.Sci Total Environ. 2019 Jun 1;667:390-399. doi: 10.1016/j.scitotenv.2019.02.341. Epub 2019 Feb 25. Sci Total Environ. 2019. PMID: 30831373 Free PMC article.
-
Analysis of inequalities in personal exposure to PM2.5: A modelling study for the Greater London school-aged population.Sci Total Environ. 2023 Dec 20;905:167056. doi: 10.1016/j.scitotenv.2023.167056. Epub 2023 Sep 16. Sci Total Environ. 2023. PMID: 37717780
-
Evaluating heterogeneity in indoor and outdoor air pollution using land-use regression and constrained factor analysis.Res Rep Health Eff Inst. 2010 Dec;(152):5-80; discussion 81-91. Res Rep Health Eff Inst. 2010. PMID: 21409949
-
Impact of climate change on the domestic indoor environment and associated health risks in the UK.Environ Int. 2015 Dec;85:299-313. doi: 10.1016/j.envint.2015.09.010. Epub 2015 Oct 30. Environ Int. 2015. PMID: 26453820 Review.
-
Indoor Exposure to Selected Air Pollutants in the Home Environment: A Systematic Review.Int J Environ Res Public Health. 2020 Dec 2;17(23):8972. doi: 10.3390/ijerph17238972. Int J Environ Res Public Health. 2020. PMID: 33276576 Free PMC article.
Cited by
-
Human exposure to indoor air pollution in Ethiopian households.Heliyon. 2022 Nov 14;8(11):e11528. doi: 10.1016/j.heliyon.2022.e11528. eCollection 2022 Nov. Heliyon. 2022. PMID: 36411936 Free PMC article. Review.
-
Socioeconomic and urban-rural differentials in exposure to air pollution and mortality burden in England.Environ Health. 2017 Oct 6;16(1):104. doi: 10.1186/s12940-017-0314-5. Environ Health. 2017. PMID: 28985761 Free PMC article.
-
Indoor Air Quality in Domestic Environments during Periods Close to Italian COVID-19 Lockdown.Int J Environ Res Public Health. 2021 Apr 12;18(8):4060. doi: 10.3390/ijerph18084060. Int J Environ Res Public Health. 2021. PMID: 33921463 Free PMC article.
-
Application of an indoor air pollution metamodel to a spatially-distributed housing stock.Sci Total Environ. 2019 Jun 1;667:390-399. doi: 10.1016/j.scitotenv.2019.02.341. Epub 2019 Feb 25. Sci Total Environ. 2019. PMID: 30831373 Free PMC article.
-
Investigation of indoor air quality in university libraries in terms of gaseous and particulate pollutants in Bartin, Turkey.Environ Monit Assess. 2022 Feb 19;194(3):200. doi: 10.1007/s10661-022-09818-8. Environ Monit Assess. 2022. PMID: 35182210 Free PMC article.
References
-
- AIVC. An Analysis and Data Summary of the AIVC's Numerical Database. Coventry, UK: Air Infiltration and Ventilation Centre (AIVC); 1994.
-
- Atkinson RW, Carey IM, Kent AJ, van Staa TP, Anderson HR, Cook DG. Long-term exposure to outdoor air pollution and incidence of cardiovascular diseases. Epidemiology. 2013;24:44–53. - PubMed
-
- BRE. SAP: The Government's Standard Assessment Procedure for Energy Rating of Dwellings. Watford, UK: Building Research Establishment; 2009.
-
- Chen C, Zhao B. Review of relationship between indoor and outdoor particles: I/O ratio, infiltration factor and penetration factor. Atmos. Environ. 2011;45:275–288.
-
- Chen C, Zhao B, Weschler CJ. Indoor exposure to “outdoor PM10”: assessing its influence on the relationship between PM10 and short-term mortality in U.S. cities. Epidemiology. 2012;23:870–878. - PubMed
Publication types
MeSH terms
Substances
LinkOut - more resources
Full Text Sources
Other Literature Sources
Medical
Molecular Biology Databases
