

Multilevel competing risk models to evaluate the risk of nosocomial infection
- PMID: 24713511
- PMCID: PMC4056071
- DOI: 10.1186/cc13821
Multilevel competing risk models to evaluate the risk of nosocomial infection
Abstract
Introduction: Risk factor analyses for nosocomial infections (NIs) are complex. First, due to competing events for NI, the association between risk factors of NI as measured using hazard rates may not coincide with the association using cumulative probability (risk). Second, patients from the same intensive care unit (ICU) who share the same environmental exposure are likely to be more similar with regard to risk factors predisposing to a NI than patients from different ICUs. We aimed to develop an analytical approach to account for both features and to use it to evaluate associations between patient- and ICU-level characteristics with both rates of NI and competing risks and with the cumulative probability of infection.
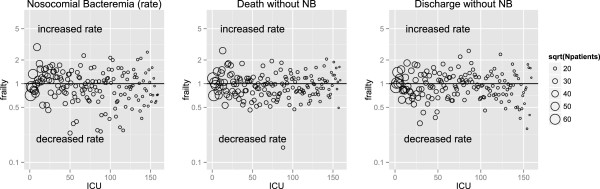
Methods: We considered a multicenter database of 159 intensive care units containing 109,216 admissions (813,739 admission-days) from the Spanish HELICS-ENVIN ICU network. We analyzed the data using two models: an etiologic model (rate based) and a predictive model (risk based). In both models, random effects (shared frailties) were introduced to assess heterogeneity. Death and discharge without NI are treated as competing events for NI.
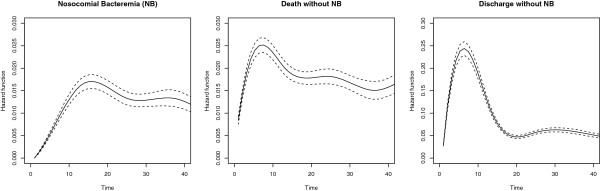
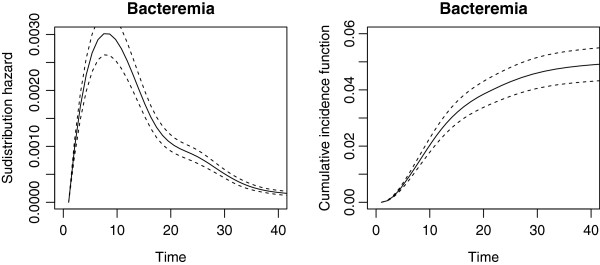
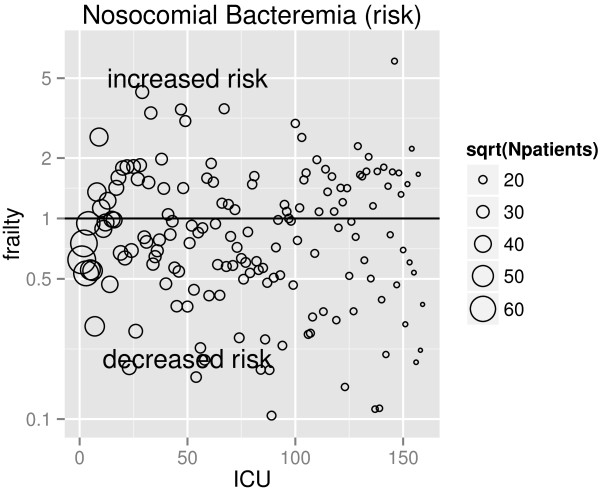
Results: There was a large heterogeneity across ICUs in NI hazard rates, which remained after accounting for multilevel risk factors, meaning that there are remaining unobserved ICU-specific factors that influence NI occurrence. Heterogeneity across ICUs in terms of cumulative probability of NI was even more pronounced. Several risk factors had markedly different associations in the rate-based and risk-based models. For some, the associations differed in magnitude. For example, high Acute Physiology and Chronic Health Evaluation II (APACHE II) scores were associated with modest increases in the rate of nosocomial bacteremia, but large increases in the risk. Others differed in sign, for example respiratory vs cardiovascular diagnostic categories were associated with a reduced rate of nosocomial bacteremia, but an increased risk.
Conclusions: A combination of competing risks and multilevel models is required to understand direct and indirect risk factors for NI and distinguish patient-level from ICU-level factors.
Figures
Comment in
-
Multilevel competing risks in the evaluation of nosocomial infections: time to move on from proportional hazards and even from hazards altogether.Crit Care. 2014 May 27;18(3):146. doi: 10.1186/cc13892. Crit Care. 2014. PMID: 25042281 Free PMC article.
References
-
- Lambert ML, Suetens C, Savey A, Palomar M, Hiesmayr M, Morales I, Agodi A, Frank U, Mertens K, Schumacher M, Wolkewitz M. Clinical outcomes of health-care-associated infections and antimicrobial resistance in patients admitted to European intensive-care units: a cohort study. Lancet Infect Dis. 2011;11:30–38. doi: 10.1016/S1473-3099(10)70258-9. - DOI - PubMed
-
- Januel JM, Harbarth S, Allard R, Voirin N, Lepape A, Allaouchiche B, Guerin C, Lehot JJ, Robert MO, Fournier G, Jacques D, Chassard D, Gueugniaud PY, Artru F, Petit P, Robert D, Mohammedi I, Girard R, Cetre JC, Nicolle MC, Grando J, Fabry J, Vanhems P. Estimating attributable mortality due to nosocomial infections acquired in intensive care units. Infect Control Hosp Epidemiol. 2010;31(4):388–394. doi: 10.1086/650754. - DOI - PubMed
-
- Roux AVD, Aiello AE. Multilevel analysis of infectious diseases. J Infect Dis. 2005;191(Supplement 1):S25–S33. - PubMed
Publication types
MeSH terms
Grants and funding
LinkOut - more resources
Full Text Sources
Other Literature Sources
