. 2014 May;124(5):1914-27.
doi: 10.1172/JCI72327. Epub 2014 Apr 8.

Autophagy-regulating TP53INP2 mediates muscle wasting and is repressed in diabetes

Autophagy-regulating TP53INP2 mediates muscle wasting and is repressed in diabetes

David Sala et al. J Clin Invest. 2014 May.

Abstract

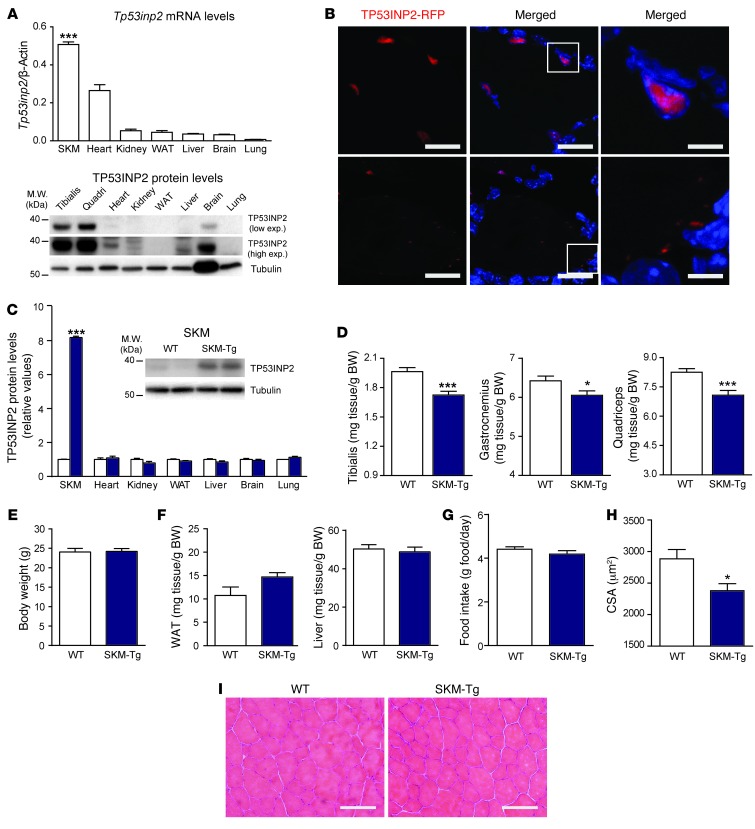
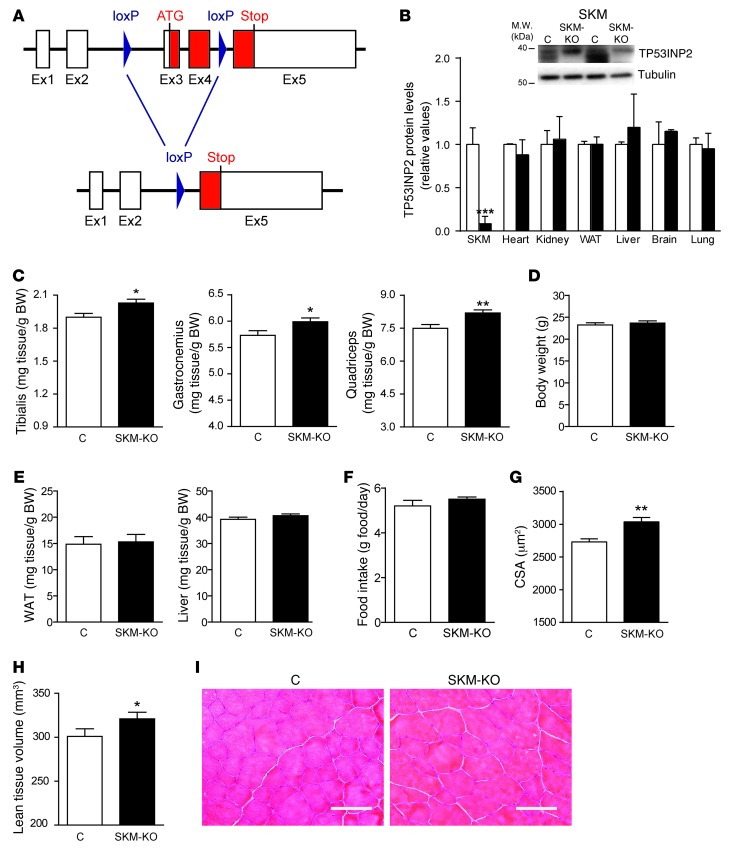
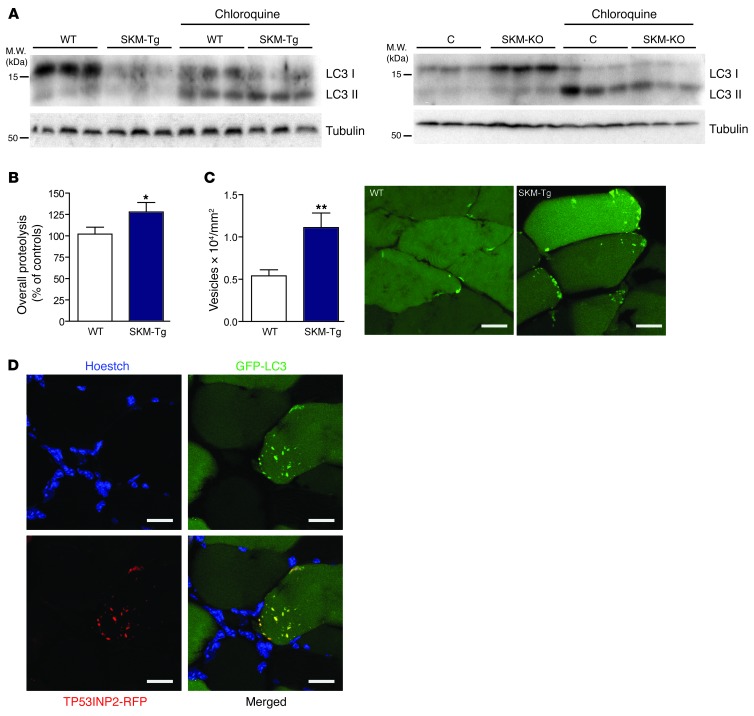
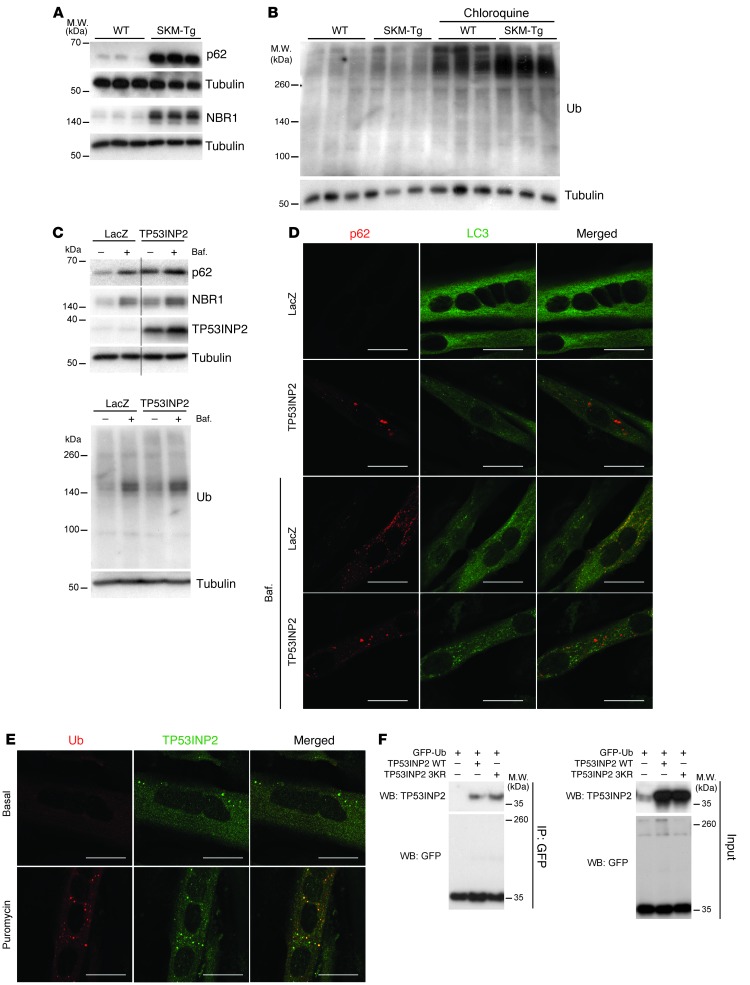
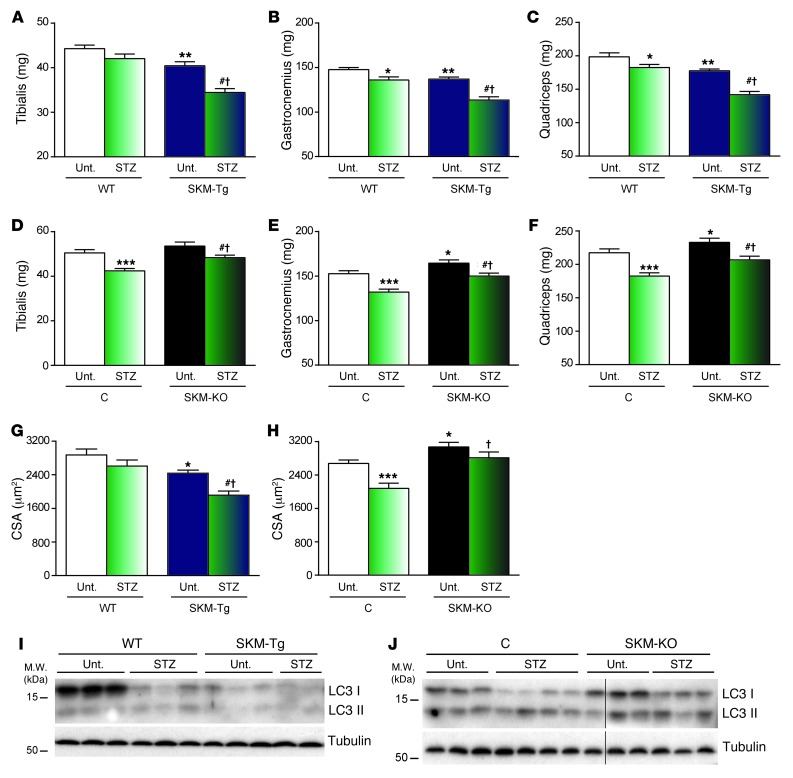
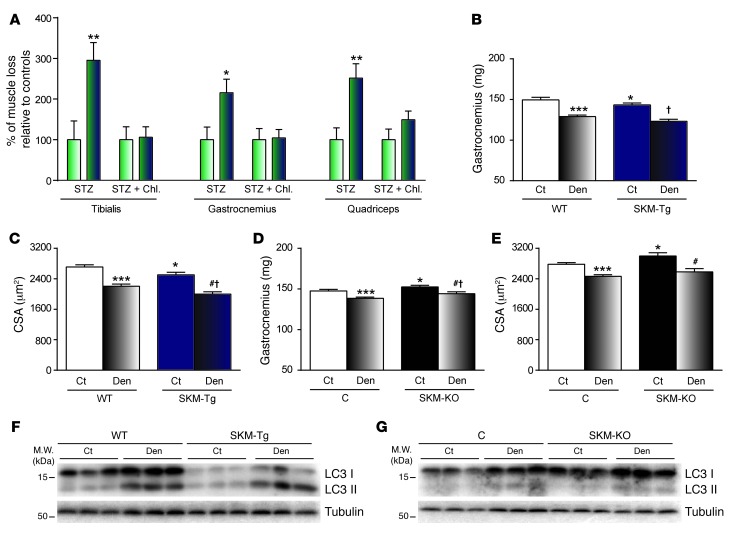
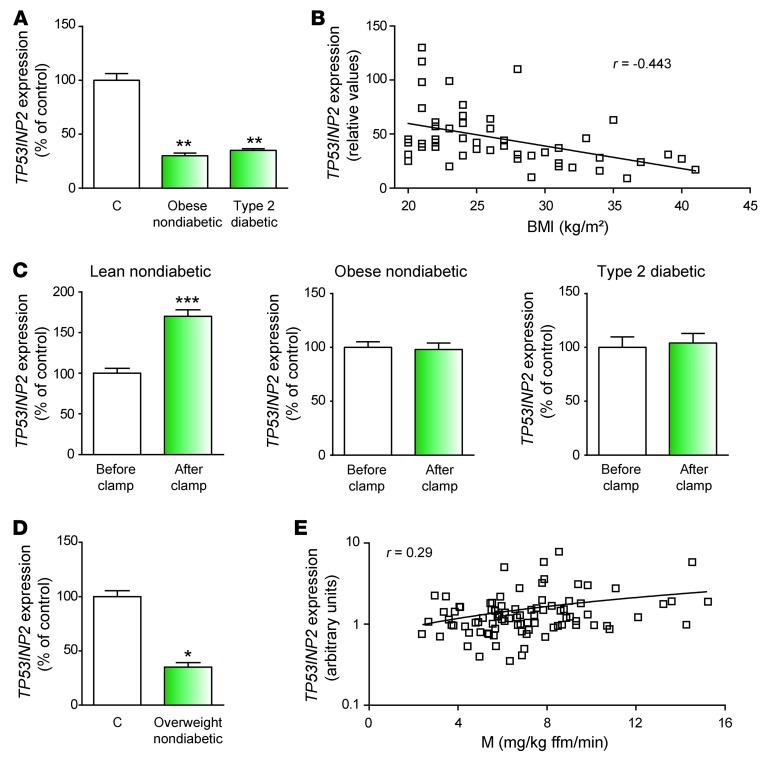
A precise balance between protein degradation and synthesis is essential to preserve skeletal muscle mass. Here, we found that TP53INP2, a homolog of the Drosophila melanogaster DOR protein that regulates autophagy in cellular models, has a direct impact on skeletal muscle mass in vivo. Using different transgenic mouse models, we demonstrated that muscle-specific overexpression of Tp53inp2 reduced muscle mass, while deletion of Tp53inp2 resulted in muscle hypertrophy. TP53INP2 activated basal autophagy in skeletal muscle and sustained p62-independent autophagic degradation of ubiquitinated proteins. Animals with muscle-specific overexpression of Tp53inp2 exhibited enhanced muscle wasting in streptozotocin-induced diabetes that was dependent on autophagy; however, TP53INP2 ablation mitigated experimental diabetes-associated muscle loss. The overexpression or absence of TP53INP2 did not affect muscle wasting in response to denervation, a condition in which autophagy is blocked, further indicating that TP53INP2 alters muscle mass by activating autophagy. Moreover, TP53INP2 expression was markedly repressed in muscle from patients with type 2 diabetes and in murine models of diabetes. Our results indicate that TP53INP2 negatively regulates skeletal muscle mass through activation of autophagy. Furthermore, we propose that TP53INP2 repression is part of an adaptive mechanism aimed at preserving muscle mass under conditions in which insulin action is deficient.


Figures

Figure 1
Figure 1. Muscle-specific TP53INP2 gain of function reduces skeletal muscle mass in a transgenic mouse model (SKM-Tg).
(A) Tp53inp2 mRNA and protein levels in different mouse tissues. The skeletal muscle (SKM) used for mRNA analysis was tibialis anterior, and tissues from 3 different male mice were used. ***P < 0.001, skeletal muscle vs. the other tissues. (B) Confocal images showing TP53INP2 localization in transverse sections from the tibialis anterior muscle. Adult muscles were electrotransferred with TP53INP2-RFP. TP53INP2 is shown in red and nuclei are shown in blue (Hoechst33342 staining). Scale bar: 20 μm (left and middle columns); 5 μm (right column). Boxes in the middle column are shown at higher magnification to the right. (C) Quantification of TP53INP2 protein levels in tissue homogenates from WT and SKM-Tg mice (n = 4). Data are shown as relative TP53INP2 levels in WT mice within each tissue. Representative images from quadriceps homogenates are shown. (D) Weights of tibialis anterior, gastrocnemius, and quadriceps muscles from 4-month-old WT and SKM-Tg mice. (E) Body weight of WT and SKM-Tg mice. (F) Epididymal adipose tissue and liver weights from WT and SKM-Tg mice. (G) Food intake of WT and SKM-Tg mice. (H) Mean cross-sectional area (CSA) of 150 myofibers per each tibialis anterior muscle. Data in D to H were obtained from 6 WT and 6 SKM-Tg mice. (I) Representative images of hematoxylin/eosin staining from WT and SKM-Tg mice. Scale bar: 100 μm. Data represent mean ± SEM. *P < 0.05, ***P < 0.001 vs. control mice.
Figure 2
Figure 2. TP53INP2-specific ablation in skeletal muscle causes muscle hypertrophy in a knockout mouse model (SKM-KO).
(A) Genomic structure of Tp53inp2 gene showing 5 exons and the corresponding 4 introns. LoxP sequences were inserted into introns 2 and 4. After Cre recombinase action, exons 3 and 4 were excised, eliminating the initiation codon. (B) Quantification of TP53INP2 protein levels in tissue homogenates from control (C) (nonexpressing Cre Tp53inp2loxP/loxP mice) and SKM-KO mice (expressing Cre Tp53inp2loxP/loxP mice). Representative images from quadriceps homogenates are shown. Data are shown as relative TP53INP2 levels in control mice within each tissue. (C) Weights of tibialis anterior, gastrocnemius, and quadriceps muscles from 4-month-old control and SKM-KO mice. (D) Body weight of control and SKM-KO mice. (E) Epididymal adipose tissue and liver weights from control and SKM-KO mice. (F) Food intake of control and SKM-KO mice. (G) Mean cross-sectional area of 150 myofibers per each tibialis anterior muscle. (H) Lean tissue volume of the right hind limb of 4-month-old control and SKM-KO mice. Data in C to H were obtained from 6 control and 10 SKM-KO mice. (I) Representative images of hematoxylin/eosin staining from control and SKM-KO mice Scale bar: 100 μm. Data represent mean ± SEM. *P < 0.05, **P < 0.01, ***P < 0.001 vs. control mice.
Figure 3
Figure 3. TP53INP2 increases basal autophagy in skeletal muscle by inducing the formation of autophagosomes.
(A) Western blot analysis of LC3I and LC3II content in total homogenates of gastrocnemius muscles from WT and SKM-Tg mice or from control and SKM-KO mice. Representative images are shown. Mice were treated with chloroquine as indicated. (B) Overall proteolysis assessed as the rate of tyrosine released to the media in incubated extensor digitorum longus muscles (n = 14). (C) Autophagosomes were quantified by counting EGFP-LC3–positive dots normalized for cross-sectional area from tibialis anterior muscles transfected with EGFP-LC3 from WT and SKM-Tg mice fasted for 16 hours (n = 5). Representative images of transverse sections from adult tibialis anterior muscles transfected with EGFP-LC3 of WT and SKM-Tg mice are shown. Scale bar: 15 μm. (D) Confocal images of tibialis anterior muscle transverse sections showing colocalization between TP53INP2 and LC3. Adult muscles were transfected with TP53INP2-RFP and EGFP-LC3. TP53INP2 is stained in red, LC3 is stained in green, and nuclei are stained in blue (Hoechst33342 staining). Scale bar: 30 μm. Data represent mean ± SEM. *P < 0.05, **P < 0.01 vs. control values.
Figure 4
Figure 4. TP53INP2 promotes degradation of ubiquitinated proteins in skeletal muscle.
(A) p62 and NBR1 protein levels in total homogenates of gastrocnemius muscles from WT and SKM-Tg mice. Representative images are shown. (B) Western blot analysis of ubiquitinated protein content in total homogenates of gastrocnemius muscles from WT and SKM-Tg mice with or without chloroquine treatment. Representative images are shown. (C) Western blot analysis of p62, NBR1, TP53INP2, and ubiquitinated protein (FK2) content in protein extracts from day 5 C2C12 myotubes overexpressing TP53INP2 or LacZ (control). Cells were treated with bafilomycin (Baf.) as indicated. Thin black lines indicate that lanes were run on the same gel but were noncontiguous. Representative images are shown. (D) Immunofluorescence against p62 and LC3 in control (LacZ) or TP53INP2-overexpressing C2C12 day 5 myotubes. Cells were treated with bafilomycin at 200 nM during 3 hours as indicated. p62 is stained in red and LC3 is stained in green. Scale bar: 20 μm. (E) Immunofluorescence against ubiquitin (FK2) and TP53INP2 in C2C12 day 5 myotubes. Cells were treated with puromycin at 50 μg/ml during 4 hours as indicated. Ub (FK2) is stained in red and TP53INP2 is stained in green. Scale bar: 20 μm. (F) HEK293T cells were transfected with plasmids coding for GFP-Ub and/or mouse TP53INP2 or mouse TP53INP2 3KR mutant. Pull-down was performed using GFP-Trap beads and inputs and pellets were probed in Western blot assays with anti-GFP and anti-TP53INP2 antibodies.
Figure 5
Figure 5. TP53INP2 enhances diabetes-induced muscle loss while it is ameliorated by TP53INP2 ablation.
(AF) Weights of (A and D) tibialis anterior, (B and E) gastrocnemius, or (C and F) quadriceps muscles from WT and SKM-Tg mice or control and SKM-KO mice with or without streptozotocin (STZ) treatment. (G and H) Mean cross-sectional area of 150 myofibers per tibialis anterior muscle from (G) WT and SKM-Tg mice or (H) control and SKM-KO mice with or without streptozotocin treatment. (I and J) Western blot analysis of LC3I and LC3II content in total homogenates of gastrocnemius muscles from WT and SKM-Tg mice or control and SKM-KO mice treated or not with streptozotocin. Thin black lines indicate that lanes were run on the same gel but were noncontiguous. Data represent mean ± SEM. (AC and G) Data were obtained from 8 untreated WT, 7 untreated SKM-Tg, 8 streptozotocin-treated WT, and 7 streptozotocin-treated SKM-Tg mice. (DF and H) Data were obtained from 7 untreated control, 7 untreated SKM-KO, 10 streptozotocin-treated control, and 12 streptozotocin-treated SKM-KO mice. *P < 0.05, **P < 0.01, ***P < 0.001 vs. untreated WT or control mice; #P < 0.01 vs. untreated SKM-Tg or SKM-KO mice; P < 0.01 vs. treated WT or control mice.
Figure 6
Figure 6. TP53INP2 does not affect muscle wasting when autophagy is blocked.
(A) Muscle loss caused by streptozotocin-induced diabetes in WT (green and white bars) and SKM-Tg mice (green and blue bars) with or without chloroquine treatment. Data are presented as percentage relative to control values. (B and D) Weights of gastrocnemius muscle and (C and E) mean cross-sectional area of 150 myofibers per tibialis anterior muscle from WT and SKM-Tg mice or control and SKM-KO mice. Sciatic nerve from right hind limb was transected (Den) and left hind limb was used as control (Ct). (F and G) Western blot analysis of LC3I and LC3II content in total homogenates of gastrocnemius muscles from denervated or nondenervated WT and SKM-Tg mice or from control and SKM-KO mice. Data represent mean ± SEM. Data in A and B were obtained from 14 WT and 11 SKM-Tg mice. Data in C and D were obtained in 9 control and 11 SKM-KO mice. *P < 0.05, **P < 0.01, ***P < 0.001 vs. nondenervated WT or control mice; #P < 0.05 vs. untreated SKM-Tg or SKM-KO mice; P < 0.05 vs. treated WT or control mice.
Figure 7
Figure 7. TP53INP2 is repressed in skeletal muscle from overweight, obese, and type 2 diabetic patients.
(A) TP53INP2 mRNA levels in skeletal muscle from type 2 diabetic and obese subjects (Lyon study). (B) TP53INP2 mRNA levels in skeletal muscle are inversely proportional to BMI. Pearson correlation analysis yielded r = –0.443 and P = 0.0014 (n = 49) (Lyon study). (C) TP53INP2 mRNA levels in skeletal muscle from nondiabetic, obese, and type 2 diabetic subjects before and after 3 hours of euglycemic-hyperinsulinemic clamp (Lyon study). (D) TP53INP2 mRNA levels in skeletal muscle from overweight subjects (Bialystock study). (E) TP53INP2 mRNA levels in skeletal muscle positively correlate with in vivo insulin action determined by the euglycemic clamp (M value; ref. 50) in nondiabetic subjects (Bialystock study). Data represent mean ± SEM. *P < 0.05, **P < 0.01, ***P < 0.001 vs. control group.

References

    1. Mitch WE, Goldberg AL. Mechanisms of muscle wasting. The role of the ubiquitin-proteasome pathway. N Engl J Med. 1996;335(25):1897–1905. doi: 10.1056/NEJM199612193352507. - DOI - PubMed
    1. Klionsky DJ. Autophagy: from phenomenology to molecular understanding in less than a decade. Nat Rev Mol Cell Biol. 2007;8(11):931–937. doi: 10.1038/nrm2245. - DOI - PubMed
    1. Mizushima N, Levine B, Cuervo AM, Klionsky DJ. Autophagy fights disease through cellular self-digestion. Nature. 2008;451(7182):1069–1075. doi: 10.1038/nature06639. - DOI - PMC - PubMed
    1. Mizushima N, Klionsky DJ. Protein turnover via autophagy: implications for metabolism. Annu Rev Nutr. 2007;27:19–40. doi: 10.1146/annurev.nutr.27.061406.093749. - DOI - PubMed
    1. Bechet D, Tassa A, Taillandier D, Combaret L, Attaix D. Lysosomal proteolysis in skeletal muscle. Int J Biochem Cell Biol. 2005;37(10):2098–2114. doi: 10.1016/j.biocel.2005.02.029. - DOI - PubMed

Publication types

MeSH terms

Substances