. 2014 May;124(5):1976-86.
doi: 10.1172/JCI73419. Epub 2014 Apr 8.

Hepatic nuclear corepressor 1 regulates cholesterol absorption through a TRβ1-governed pathway

Hepatic nuclear corepressor 1 regulates cholesterol absorption through a TRβ1-governed pathway

Inna Astapova et al. J Clin Invest. 2014 May.

Abstract

Transcriptional coregulators are important components of nuclear receptor (NR) signaling machinery and provide additional mechanisms for modulation of NR activity. Expression of a mutated nuclear corepressor 1 (NCoR1) that lacks 2 NR interacting domains (NCoRΔID) in the liver leads to elevated expression of genes regulated by thyroid hormone receptor (TR) and liver X receptor (LXR), both of which control hepatic cholesterol metabolism. Here, we demonstrate that expression of NCoRΔID in mouse liver improves dietary cholesterol tolerance in an LXRα-independent manner. NCoRΔID-associated cholesterol tolerance was primarily due to diminished intestinal cholesterol absorption as the result of changes in the composition and hydrophobicity of the bile salt pool. Alterations of the bile salt pool were mediated by increased expression of genes encoding the bile acid metabolism enzymes CYP27A1 and CYP3A11 as well as canalicular bile salt pump ABCB11. We have determined that these genes are regulated by thyroid hormone and that TRβ1 is recruited to their regulatory regions. Together, these data indicate that interactions between NCoR1 and TR control a specific pathway involved in regulation of cholesterol metabolism and clearance.


Figures

Figure 1
Figure 1. Hepatic cholesterol synthesis and deposition in L-ΔID mice.
(A) The rate of neutral sterol synthesis was assessed in primary hepatocytes isolated from L-ΔID and control mice by incorporation of 3H2O. Shown are data from 1 representative experiment (n = 4 wells per genotype). Expression of Hmgcr was measured by QPCR in the hepatocytes from the same experiment (n = 3 wells per genotype). (B) Representative H&E-stained sections of livers from animals with indicated genotypes after 3 weeks on 2% cholesterol diet. Original magnification, ×20. (C) Hepatic cholesterol content was measured in control and L-ΔID mice on Lxra+/+ and Lxra–/– background after 3 weeks on 2% cholesterol diet (n = 5–11 animals per group). Statistical analysis was performed using unpaired Student’s t test (A) or 2-way ANOVA with Bonferroni post-tests (C). **P ≤ 0.01; ***P ≤ 0.001.
Figure 2
Figure 2. Effects of hepatic expression of NCoRΔID on plasma lipoprotein and whole-body cholesterol content.
(A) Cholesterol concentrations were measured in FPLC fractions of pooled plasma from animals with indicated genotypes fed a 2% cholesterol diet for 3 weeks (n = 6–9 animals per group). (B) VLDL clearance was blocked in control and L-ΔID mice on Lxra+/+ and Lxra–/– backgrounds by intravenous injection of 600 mg/kg tyloxapol. VLDL accumulation in blood was assessed by measuring plasma triglycerides at indicated time points. Animals were kept on high-cholesterol diet for 3 weeks prior to the experiment (n = 5–8 animals per group). (C) Whole carcasses (excluding liver and gut) of mice with indicated genotypes fed 2% cholesterol for 3 weeks were digested in ethanolic KOH, and whole-body cholesterol content was measured (n = 5–8 animals per group). (D) Expression of Ldlr, Mylip (Idol), and Scarb1 was measured by QPCR in the livers of animals after 3 days of 2% cholesterol feeding (n = 6–8 animals per group). Statistical analysis was performed using 2-way ANOVA with Bonferroni’s post-tests. *P ≤ 0.05; **P ≤ 0.01.
Figure 3
Figure 3. Effects of hepatic NCoRID on cholesterol excretion and intestinal cholesterol absorption.
Body weight (A), daily food intake (B), daily fecal output (C), and fecal cholesterol concentrations (D) were measured in single caged mice over the 3 last days of the 3 weeks of high-cholesterol feeding (n = 5–8 animals per group). (E) Biliary cholesterol was measured in gall bladder bile of mice with indicated genotypes (n = 3–8 animals per group). (F) Hepatic expression of cholesterol transporters Abcg5/8 in the animals with indicated genotypes (n = 5–11 animals per group). (G) Fractional cholesterol absorption was measured in L-ΔID and control animals on Lxra+/+ and Lxra–/– background by dual-isotope plasma method. The data presented are calculated based on the 72-hour time point after tracer administration (n = 5–9 animals per group). All animals were fed a 2% cholesterol diet for 3 weeks prior to the experiments. Statistical analysis was performed using 2-way ANOVA with Bonferroni’s post-tests. *P ≤ 0.05; ***P ≤ 0.001.
Figure 4
Figure 4. Bile acid metabolism in L-ΔID mice.
Total serum (A) (n = 6–10 animals per group), hepatic (B) (n = 5–11 animals per group), biliary (C) (n = 3–8 animals per group), and fecal (D) (n = 5–8 animals per group) bile acid concentration in control and L-ΔID animals on Lxra+/+ and Lxra–/– backgrounds. (E-G) Bile salts were extracted from liver, gall bladder, and small intestine that were collected from animals with the indicated genotypes. The size (E) and composition (F) were analyzed using HPLC and hydrophobicity index (G) was calculated by the method of Heuman (63). (n = 4–8 animals per group). TMC, tauromuricholate; TUDC, tauroursodeoxycholate; TC, taurocholate; TCDC, taurochenodeoxycholate; TDC, taurodeoxycholate. All animals were fed 2% cholesterol–supplemented chow for 3 weeks prior to the experiments. Statistical analysis was performed using 2-way ANOVA with Bonferroni’s post-tests. *P ≤ 0.05; ***P ≤ 0.001.
Figure 5
Figure 5. Hepatic expression of bile acid metabolism enzymes and transporters in L-ΔID animals.
mRNA expression levels of genes involved in bile acid synthesis, hydroxylation, and transport were quantified by QPCR (A) in the livers of control and L-ΔID animals on Lxra+/+ and Lxra–/– backgrounds fed with 2% cholesterol diet for 3 days (n = 7–9 animals per group); (B) in the livers of chow-fed mice (n = 5–9 animals per group); (C) in primary hepatocytes isolated from chow-fed animals with indicated genotypes. Shown are results of 1 experiment (n = 3 wells per genotype). Statistical analysis was performed using 2-way ANOVA with Bonferroni’s post-tests (A and B) or unpaired Student’s t test (C) where Lxra+/+ and Lxra–/– hepatocytes were isolated on different days and no attempt was made to compare these 2 groups. *P ≤ 0.05; **P ≤ 0.01; ***P ≤ 0.001.
Figure 6
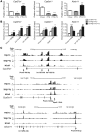
Figure 6. Cyp27a1, Cyp3a11, and Abcb11 are TR targets.
(A) Expression of indicated genes was quantified by QPCR on RNA isolated from the livers of euthyroid (chow), hypothyroid (PTU), and hyperthyroid (PTU+T3) WT mice. (n = 6–7 animals per group). (B) ChIP followed by QPCR for indicated regions of Cyp27a1, Cyp3a11, and Abcb11 genes was performed using streptavidin-agarose and chromatin isolated from livers of mice with hepatic adenovirus–mediated overexpression of GFP (control) or biotinylated TRβ1 (n = 5 affinity precipitation reactions per group). Statistical analysis was performed using 1-way ANOVA followed by Tukey’s multiple comparisons test. *P ≤ 0.05; **P ≤ 0.01; ***P ≤ 0.001. (C) Snapshots of UCSC genome browser showing alignment of histograms for TR ChIP peaks obtained in our laboratory (TRβ T3, TRβ PTU) and NCoR1 ChIP peaks (NCoR) obtained by Feng et al. (42).

References

    1. Calkin AC, Tontonoz P. Liver x receptor signaling pathways and atherosclerosis. Arterioscler Thromb Vasc Biol. 2010;30(8):1513–1518. doi: 10.1161/ATVBAHA.109.191197. - DOI - PMC - PubMed
    1. Erion MD, et al. Targeting thyroid hormone receptor-beta agonists to the liver reduces cholesterol and triglycerides and improves the therapeutic index. Proc Natl Acad Sci U S A. 2007;104(39):15490–15495. doi: 10.1073/pnas.0702759104. - DOI - PMC - PubMed
    1. Berkenstam A, et al. The thyroid hormone mimetic compound KB2115 lowers plasma LDL cholesterol and stimulates bile acid synthesis without cardiac effects in humans. Proc Natl Acad Sci U S A. 2008;105(2):663–667. doi: 10.1073/pnas.0705286104. - DOI - PMC - PubMed
    1. Ladenson PW, et al. Use of the thyroid hormone analogue eprotirome in statin-treated dyslipidemia. N Engl J Med. 2010;362(10):906–916. doi: 10.1056/NEJMoa0905633. - DOI - PubMed
    1. Johansson L, et al. Selective thyroid receptor modulation by GC-1 reduces serum lipids and stimulates steps of reverse cholesterol transport in euthyroid mice. Proc Natl Acad Sci U S A. 2005;102(29):10297–10302. doi: 10.1073/pnas.0504379102. - DOI - PMC - PubMed

Publication types

MeSH terms