. 2014 Apr 8;12(4):e1001833.
doi: 10.1371/journal.pbio.1001833. eCollection 2014 Apr.

CD4CD8αα lymphocytes, a novel human regulatory T cell subset induced by colonic bacteria and deficient in patients with inflammatory bowel disease

Affiliations

CD4CD8αα lymphocytes, a novel human regulatory T cell subset induced by colonic bacteria and deficient in patients with inflammatory bowel disease

Guillaume Sarrabayrouse et al. PLoS Biol. .

Abstract

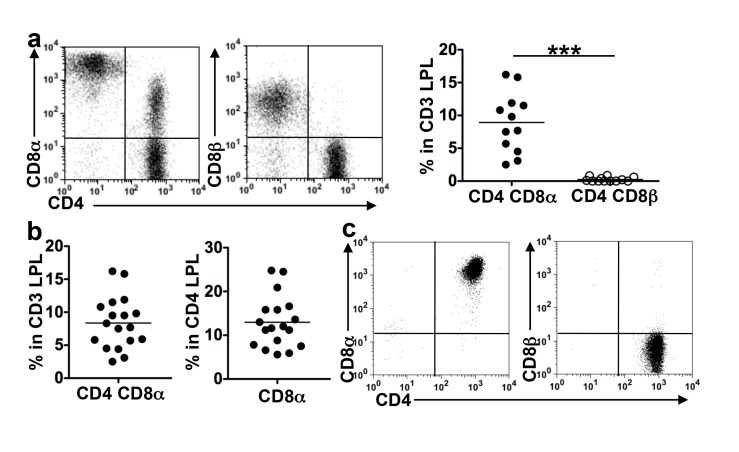
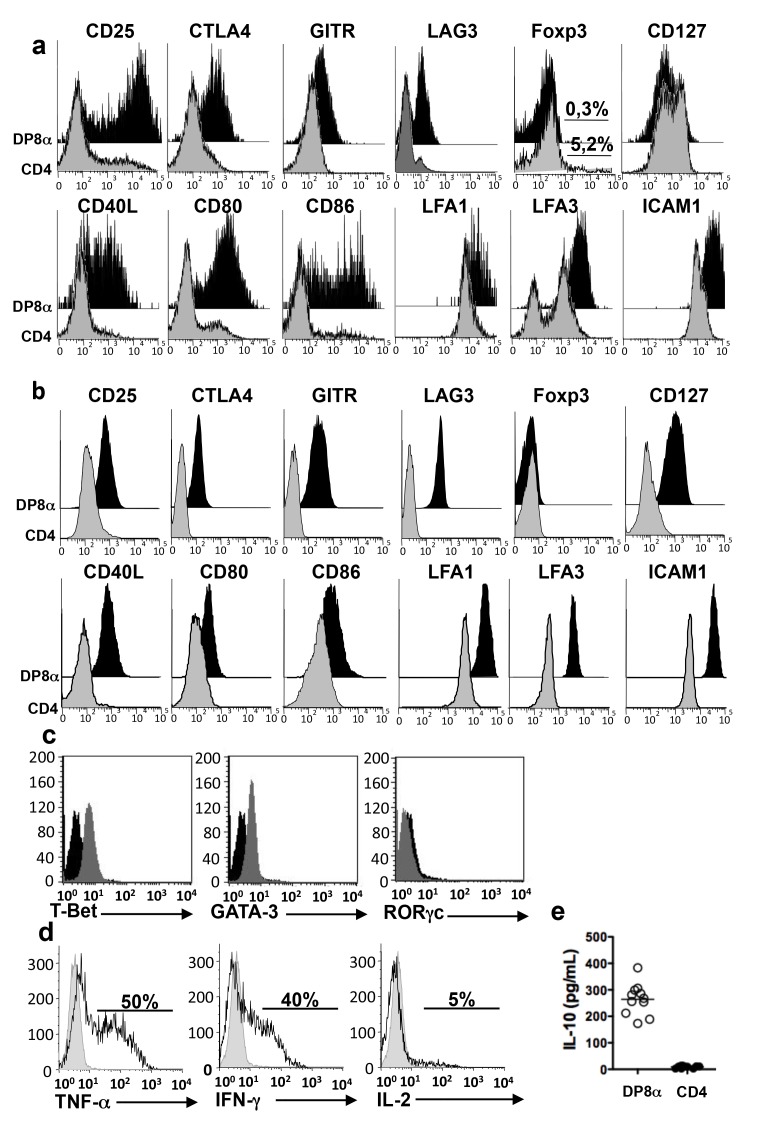
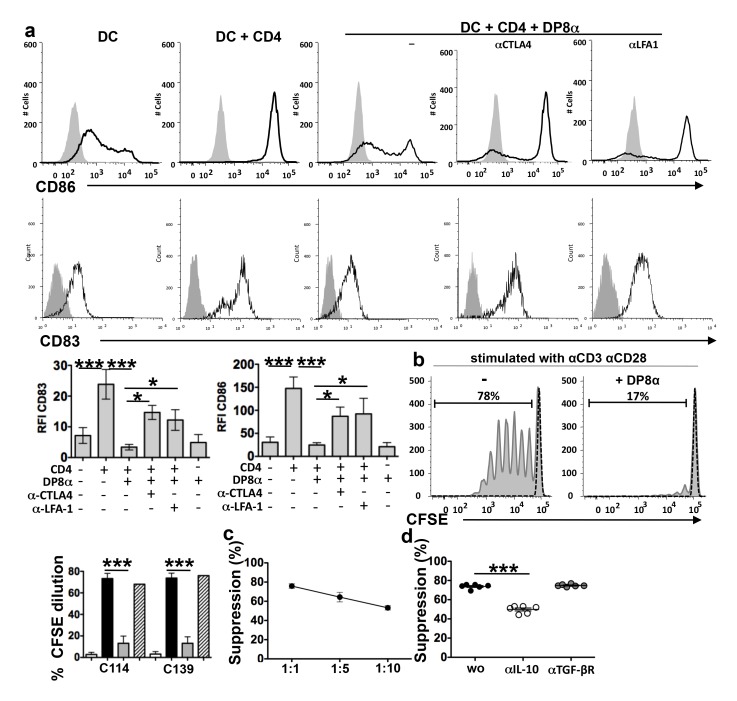
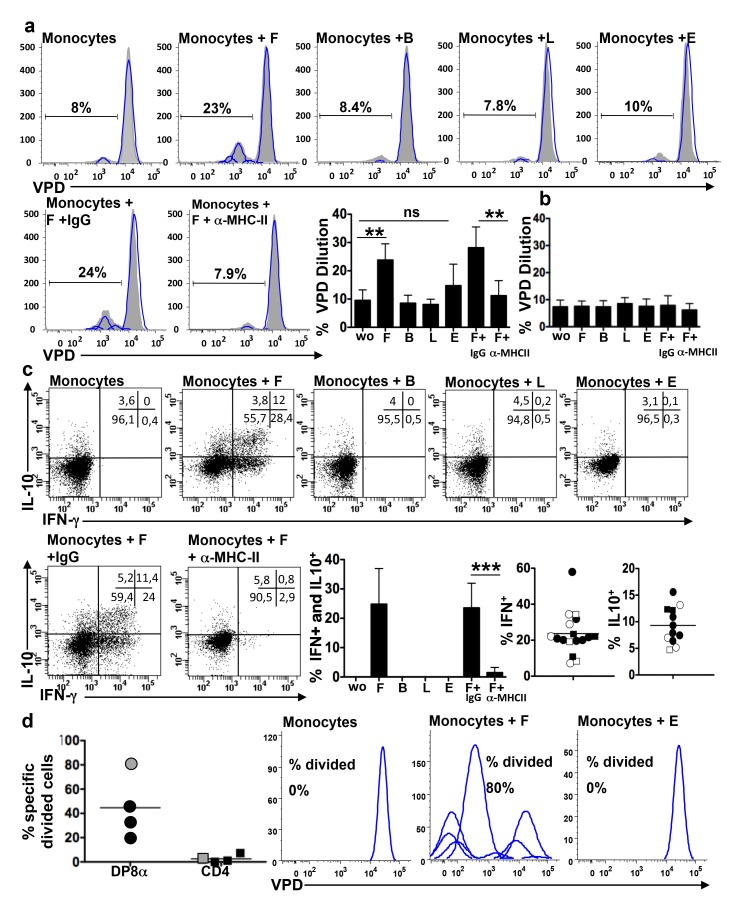
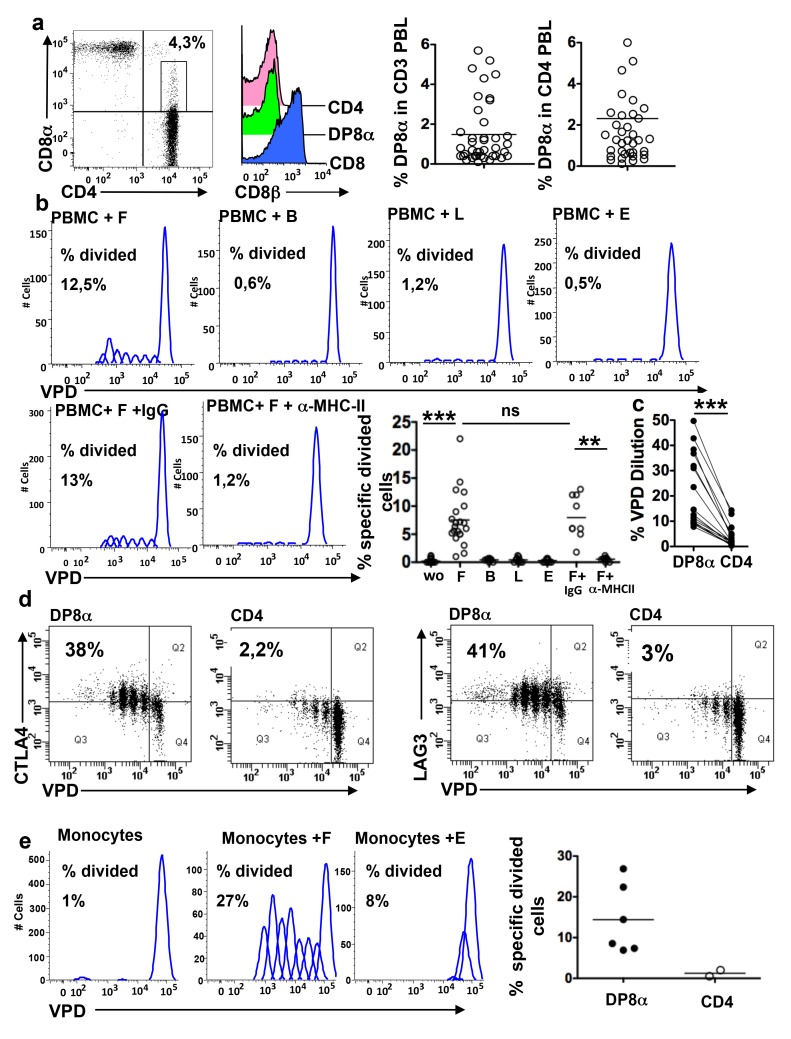
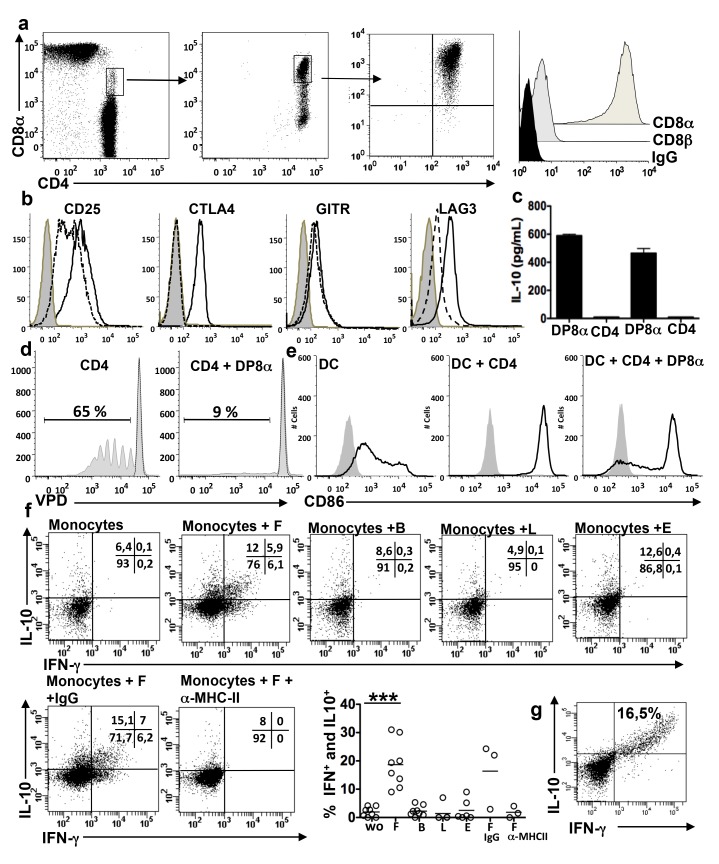
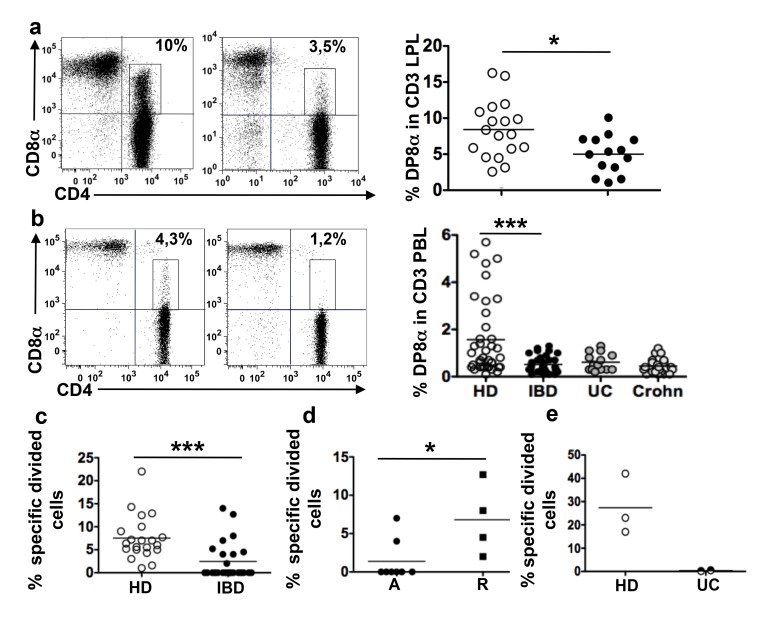
How the microbiota affects health and disease is a crucial question. In mice, gut Clostridium bacteria are potent inducers of colonic interleukin (IL)-10-producing Foxp3 regulatory T cells (Treg), which play key roles in the prevention of colitis and in systemic immunity. In humans, although gut microbiota dysbiosis is associated with immune disorders, the underlying mechanism remains unknown. In contrast with mice, the contribution of Foxp3 Treg in colitis prevention has been questioned, suggesting that other compensatory regulatory cells or mechanisms may exist. Here we addressed the regulatory role of the CD4CD8 T cells whose presence had been reported in the intestinal mucosa and blood. Using colonic lamina propria lymphocytes (LPL) and peripheral blood lymphocytes (PBL) from healthy individuals, and those with colon cancer and irritable bowel disease (IBD), we demonstrated that CD4CD8αα (DP8α) T lymphocytes expressed most of the regulatory markers and functions of Foxp3 Treg and secreted IL-10. Strikingly, DP8α LPL and PBL exhibited a highly skewed repertoire toward the recognition of Faecalibacterium prausnitzii, a major Clostridium species of the human gut microbiota, which is decreased in patients with IBD. Furthermore, the frequencies of DP8α PBL and colonic LPL were lower in patients with IBD than in healthy donors and in the healthy mucosa of patients with colon cancer, respectively. Moreover, PBL and LPL from most patients with active IBD failed to respond to F. prausnitzii in contrast to PBL and LPL from patients in remission and/or healthy donors. These data (i) uncover a Clostridium-specific IL-10-secreting Treg subset present in the human colonic LP and blood, (ii) identify F. prausnitzii as a major inducer of these Treg, (iii) argue that these cells contribute to the control or prevention of colitis, opening new diagnostic and therapeutic strategies for IBD, and (iv) provide new tools to address the systemic impact of both these Treg and the intestinal microbiota on the human immune homeostasis.


Conflict of interest statement

The authors have declared that no competing interests exist.

Figures

Figure 1
Figure 1. DP8α are frequently found in the lamina propria of healthy colon mucosa.
Freshly dissociated CD3 LPL and cell lines were analyzed by flow cytometry for the co-expression of CD4 and either CD8α or CD8β. (a) Representative dot plots and frequencies of CD4 T cells co-expressing CD8α or CD8β among the CD3 LPL from 12 donors; ***p<0.001 (paired t-test). (b) Frequencies of CD4CD8αα cells among the CD3 or CD3CD4 LPL (n = 18). (c) Stable co-expression of CD4 and CD8α but not CD8β, by a cell line (representative of four) obtained from FACS-sorted DP8α colonic LPL, after several transfers in culture.
Figure 2
Figure 2. Regulatory phenotype and cytokine profile of DP8α LPL.
(a) Comparison of the phenotypes of DP8α and CD4 lymphocytes among CD3 LPL freshly dissociated from healthy colonic mucosa (representative of three) (b) Phenotypes of autologous DP8α and CD4 LPL lines (representative of three pairs). (c) Expression of transcription factors by a DP8α cell line (representative of three) measured by intracellular labelling. (d) Intracellular staining for TNF-α, IFN-γ, and IL-2 in a DP8α LPL line (representative of three) stimulated for 5 h with an anti-CD3 antibody in the presence of BFA. (e) IL-10 in the supernatants of DP8α (white circles) and CD4 (black circles) LPL lines (n = 3) activated by an anti-CD3 antibody for 48 h as measured by ELISA (three experiments in triplicate for each cell line).
Figure 3
Figure 3. Regulatory functions of DP8α LPL lines.
(a) DP8α LPL lines blocked the maturation of immature DC induced by activated CD4 lymphocytes, as shown by the inhibition of CD83 and CD86 up-regulation, and this inhibition was partially neutralised by anti-CTLA-4 and ant-LFA-1 antibodies. Immature DC were incubated for 5 d with CD4 PBL lines (expressing CD40L) in the presence or absence of DP8α LPL lines and anti-CTLA4 or anti-LFA-1 antibodies. The CD83 and CD86 expression levels were measured on gated CD3 negative cells: representative histograms and median for the CD83 and CD86 relative fluorescence intensity (RFI); (n = 6, two experiments performed with three cell lines); ***p<0.001, **p<0.01, and *p<0.05 (paired t-test). (b) Inhibition of the proliferative response of CD4 PBL by the DP8α LPL and CD4 LPL lines C114, C139 as measured by CFSE dilution. CD4 PBL sorted from healthy donor PBMC were stimulated with anti-CD3 and anti-CD28 in the presence or absence of DP8α LPL lines for 5 d at a ratio of 1∶1: representative cytometry data and histograms showing the CFSE dilution in CD8 negative lymphocytes: unstimulated (white histograms), stimulated (black histograms) stimulated in the presence of DP8α LPL (grey histograms), and stimulated in the presence of CD4 LPL (hachured histograms) (n = 12: six experiments done with two DP8α LPL lines); ***p<0.001 (paired t-test). (Only one experiment performed with the CD4 LPL lines) (c) Percent inhibition of CD4 lymphocyte proliferation by DP8α LPL lines at the indicated E∶T ratios. (d) Percent suppression of CD4 lymphocyte proliferation by DP8α LPL at a ratio of 1∶1 in the presence or absence of anti-IL-10 or anti-TGF-βR blocking antibodies; ***p<0.001 (paired t-test).
Figure 4
Figure 4. DP8α LPL specifically respond to the gut commensal bacterium F. prausnitzii.
Flow cytometry analysis of the proliferative response (VPD dilution and FlowJo analysis) of DP8α LPL (a) or CD4 LPL lines (b) after 3 d of co-culture with allogeneic monocytes alone or loaded overnight with F in the presence or absence of an anti-MHC class-II antibody or of an irrelevant antibody (IgG), or with monocytes loaded with B, L, or E: representative cytometry data and mean percentage of VPD low cells (n = 6: two independent experiments performed with three DP8α LPL lines); **p<0.01 (paired t-test). (c) Flow cytometry analysis of the IFN-γ and IL-10 responses of DP8α LPL lines (n = 4) after 6 h of stimulation by monocytes, loaded overnight by F (1∶5) in the presence or absence of anti MHC class-II antibody or of an irrelevant antibody, or not loaded, or loaded with B, L, or E: representative response of the C139 DP8α LPL line and the percentages of cells secreting IL-10 or IFN- γ or both in independent experiments (two to seven experiments performed with four DP8α LPL lines: C114, black circles; C139, white circles; C192, white squares; and C140, black squares; ***p<0.001 (paired t-test). (d) Flow cytometry analysis of the proliferative response of freshly dissociated LPL from three donors stimulated by allogeneic monocytes (black symbols) and of sorted DP8α and CD4 LPL from one donor (grey symbols) stimulated by autologous monocytes. Responses were analyzed after 5 d of co-culture with monocytes alone or monocytes loaded overnight with F or E: mean percentage of F specific divided cells (with deduction of the divided cells to monocytes alone) (calculated on FlowJo software) and representative cytometry data of the proliferative response of the freshly sorted DP8α LPL population.
Figure 5
Figure 5. Presence of F-reactive DP8α T lymphocytes in the blood of healthy individuals.
(a) Flow cytometry analysis of the frequencies of DP8α T lymphocytes in the blood of 18 donors: representative dot plot of PBMC co-labelled with anti-CD3, anti-CD4, and anti-CD8α antibodies, representative histogram of CD8β expression by gated CD8, CD4, and DP8α PBMC, and the percentages of DP8α lymphocytes among the CD3 and the CD3CD4 PBMC. (b) Proliferative responses of DP8α peripheral blood T cells to F in the presence or absence of an anti-MHC class-II antibody or an irrelevant antibody, and to B, L, and E. PBMC were cultured for 5 d with the antibody and/or indicated bacteria at a bacterium∶PBMC ratio 1∶1: representative FlowJo analysis of the VPD dilution and percentage of F-specific divided DP8α T cells in the PBMC from several donors (n = 18); ***p<0.001 and **p<0.01 (paired t-test). (c) Percent VPD dilution in paired DP8α and CD4 T cells among PBMC co-cultured with F for 5 d; ***p<0.001 (paired t-test). (d) CTLA4 and LAG3 expression in proliferative DP8α and CD4 PBL after 5 d of co-culture with allogeneic monocytes loaded overnight with F (n = 2). (e) Flow cytometry analysis of the proliferative response of freshly isolated DP8α or CD4 PBL after 5 d of co-culture with autologous monocytes alone or loaded overnight with F or E: representative cytometry data of a freshly sorted DP8α PBL population and mean percentage of F-specific divided cells (calculated on FlowJo software) (experiments performed with five freshly isolated DP8α PBL (black circles) and two CD4 PBL (white circles).
Figure 6
Figure 6. DP8α PBL lines are phenotypically and functionally similar to DP8α LPL lines.
(a) Left and middle: representative staining and gating options used in the two successive sorts performed to obtain the DP8α PBL lines (n = 4); middle and right: phenotype of the lymphocytes obtained following polyclonal T cell expansion of the first and second sort, respectively, and representative histogram of CD8α and CD8β expression by DP8α PBL lines. (b) The DP8α PBL lines (n = 4) had a Treg phenotype (full line white histograms), in contrast with CD4 PBL lines (n = 3) (dotted line white histograms) (isotype control: grey histograms). (c) IL-10 secretion by two DP8α PBL lines and their CD4 homologues, upon stimulation with anti-CD3 antibody as measured by ELISA. (d) Representative in vitro inhibition of CD4 T lymphocyte proliferation by the DP8α PBL lines as in Figure 3b (n = 6: two experiments performed with three cell lines). (e) Representative inhibition of DC maturation by DP8α PBL lines as in Figure 3a (n = 6: two experiments performed with three cell lines). (f) IL-10 and IFN-γ responses of the DP8α PBL lines to monocytes loaded or not with F, B, L, or E, as in Figure 4c: representative dot plots and percentages of IFN-γ and IL-10 secreting cells (three experiments performed with two to three cell lines). ***p<0.001 (paired t-test). (g) Representative dot plot of an optimal IL-10 and IFN-γ response to F of a DP8α PBL line stimulated as in (f).
Figure 7
Figure 7. DP8α LPL and PBL, and the PBL reactivity to F, are decreased in patients with IBD.
(a) Representative dot plots and frequencies of DP8α lymphocytes among CD3 LPL freshly dissociated from the inflamed mucosa of patients with IBD (right plot and black circles, n = 14) and healthy colon mucosa from patients with CC (left plot and white circles, n = 18); *p<0.05 (t-test). (b) Representative dot plots and frequencies of DP8α PBL in healthy donors (white circles, n = 38), patients with IBD (black circles, n = 36), patients with UC (grey circles, n = 14), and patients with Crohn disease (grey circles, n = 22); ***p<0.001 (t-test). (c) Flow cytometry analysis with the FlowJo software of the proliferative response (percent of F-specific divided cells) of DP8α PBMC from healthy donors (HD) (n = 21) or patients with IBD (n = 25), after 5 d of culture with F; ***p<0.001 (t-test). (d) As in (c) percent F-responder cells (F-specific DP8α divided cells) among PBMCs from L1 and L3 patients with Crohn disease in remission (R) and with active disease (A); *p<0.05 (Mann-Whitney test). (e) Flow cytometry analysis with the FlowJo software of the proliferative response (percent of F-specific divided cells) of DP8α lymphocytes among LPL freshly isolated from healthy mucosa (white circles, n = 3) and UC mucosa (black circles, n = 2), following stimulation for 5 d by a mix of allogeneic monocytes isolated from the blood of three healthy donors and previously incubated overnight with F.

Comment in

References

    1. Honda K, Littman DR (2012) The microbiome in infectious disease and inflammation. Annu Rev Immunol 30: 759–795. - PMC - PubMed
    1. Sokol H, Pigneur B, Watterlot L, Lakhdari O, Bermudez-Humaran LG, et al. (2008) Faecalibacterium prausnitzii is an anti-inflammatory commensal bacterium identified by gut microbiota analysis of Crohn disease patients. Proc Natl Acad Sci U S A 105: 16731–16736. - PMC - PubMed
    1. Willing B, Halfvarson J, Dicksved J, Rosenquist M, Jarnerot G, et al. (2009) Twin studies reveal specific imbalances in the mucosa-associated microbiota of patients with ileal Crohn's disease. Inflamm Bowel Dis 15: 653–660. - PubMed
    1. Manichanh C, Borruel N, Casellas F, Guarner F (2012) The gut microbiota in IBD. Nat Rev Gastroenterol Hepatol 9: 599–608. - PubMed
    1. Nagano Y, Itoh K, Honda K (2012) The induction of Treg cells by gut-indigenous Clostridium. Curr Opin Immunol 24: 392–397. - PubMed

Publication types

MeSH terms