. 2014 Apr 8;9(4):e94054.
doi: 10.1371/journal.pone.0094054. eCollection 2014.

Comprehensive evaluation of peripheral nerve regeneration in the acute healing phase using tissue clearing and optical microscopy in a rodent model

Affiliations

Comprehensive evaluation of peripheral nerve regeneration in the acute healing phase using tissue clearing and optical microscopy in a rodent model

Yookyung Jung et al. PLoS One. .

Abstract

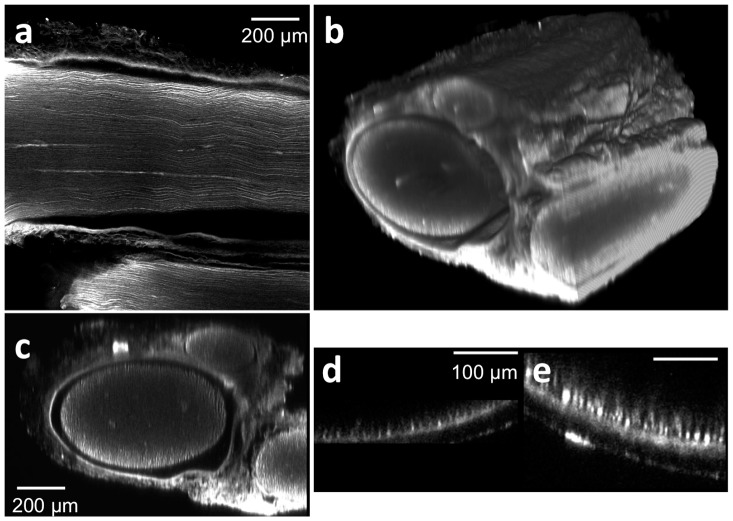
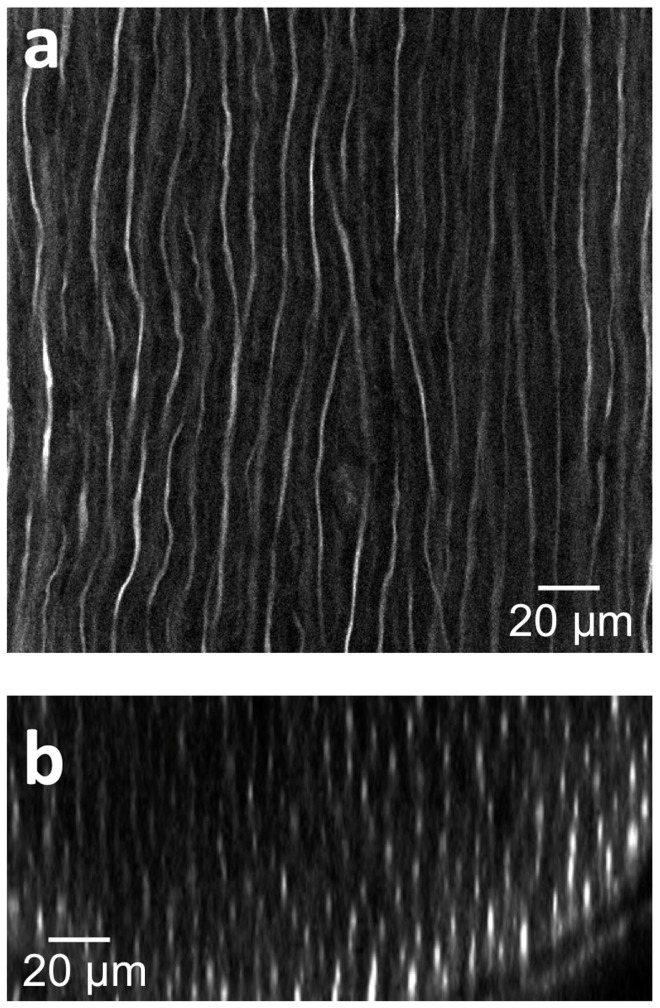
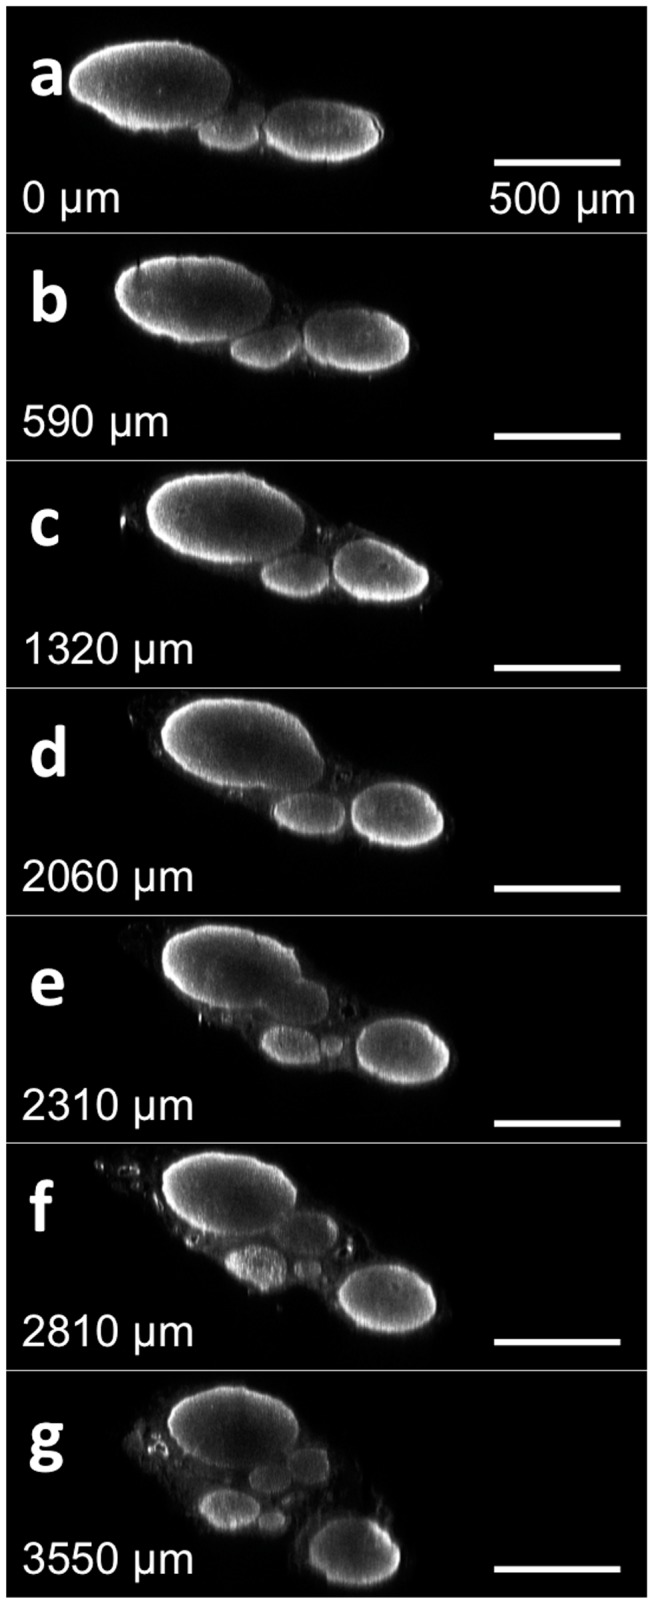
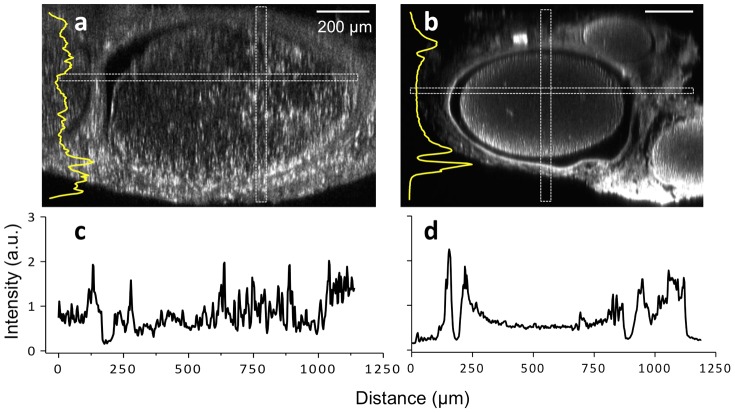
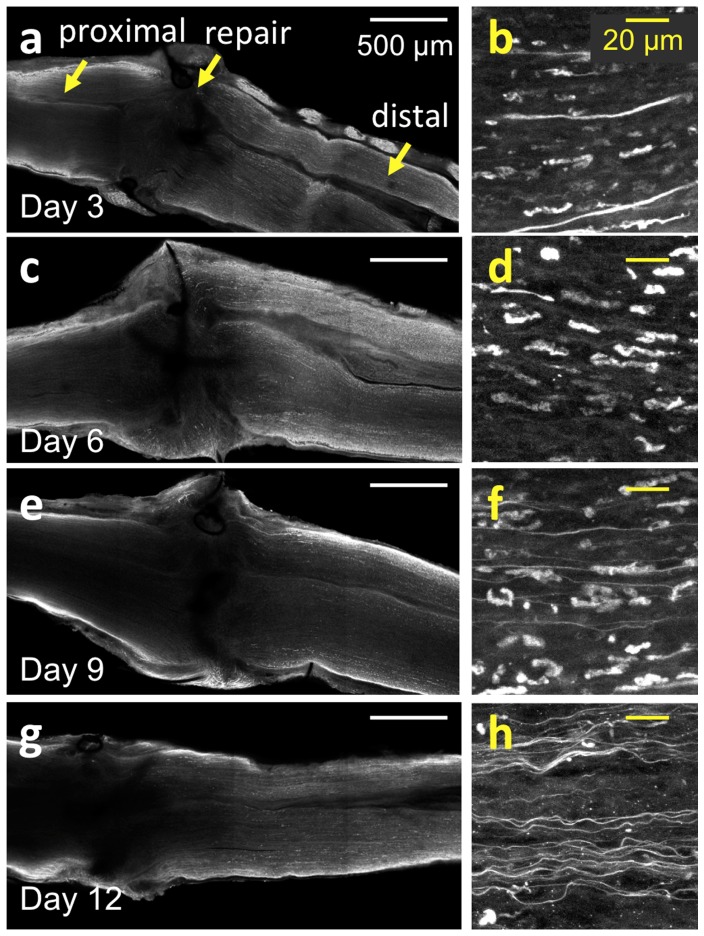
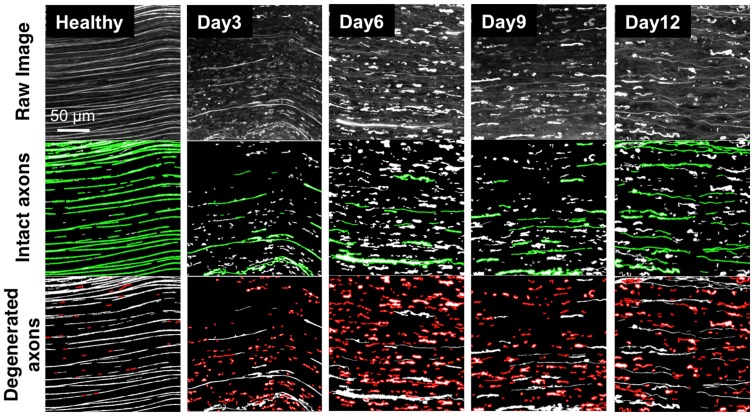
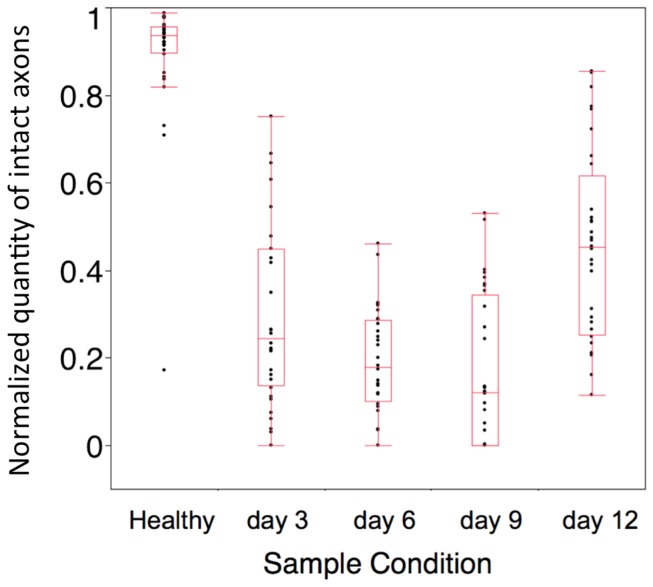
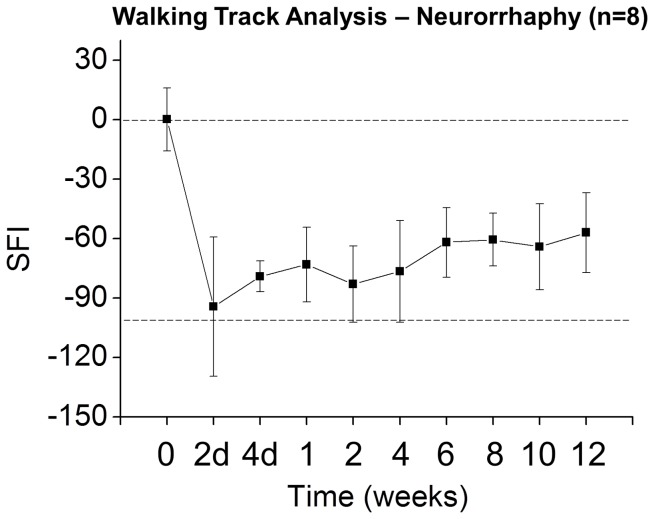
Peripheral nerve injury (PNI), a common injury in both the civilian and military arenas, is usually associated with high healthcare costs and with patients enduring slow recovery times, diminished quality of life, and potential long-term disability. Patients with PNI typically undergo complex interventions but the factors that govern optimal response are not fully characterized. A fundamental understanding of the cellular and tissue-level events in the immediate postoperative period is essential for improving treatment and optimizing repair. Here, we demonstrate a comprehensive imaging approach to evaluate peripheral nerve axonal regeneration in a rodent PNI model using a tissue clearing method to improve depth penetration while preserving neural architecture. Sciatic nerve transaction and end-to-end repair were performed in both wild type and thy-1 GFP rats. The nerves were harvested at time points after repair before undergoing whole mount immunofluorescence staining and tissue clearing. By increasing the optic depth penetration, tissue clearing allowed the visualization and evaluation of Wallerian degeneration and nerve regrowth throughout entire sciatic nerves with subcellular resolution. The tissue clearing protocol did not affect immunofluorescence labeling and no observable decrease in the fluorescence signal was observed. Large-area, high-resolution tissue volumes could be quantified to provide structural and connectivity information not available from current gold-standard approaches for evaluating axonal regeneration following PNI. The results are suggestive of observed behavioral recovery in vivo after neurorrhaphy, providing a method of evaluating axonal regeneration following repair that can serve as an adjunct to current standard outcomes measurements. This study demonstrates that tissue clearing following whole mount immunofluorescence staining enables the complete visualization and quantitative evaluation of axons throughout nerves in a PNI model. The methods developed in this study could advance PNI research allowing both researchers and clinicians to further understand the individual events of axonal degeneration and regeneration on a multifaceted level.


Conflict of interest statement

Competing Interests: The authors have declared that no competing interests exist.

Figures

Figure 1
Figure 1. Tissue clearing following antibody staining allows for visualization of axons throughout entire rat sciatic nerves.
Tissue were stained with anti-neurofilament antibodies using a whole mount immunofluorescence method. (a) A lateral (xy) confocal image at the depth of approximately 400 μm from the surface of a stained and cleared wild type rat sciatic nerve. (b) Three dimensional view of a whole stained and cleared sciatic nerve. Non-specific GFP epineurial staining can also be seen secondary to presence of fibroblasts, collagen, and vasa nervorum in the epineurium, which does not affect analysis. (c) Reconstructed transverse cross sectional image. Three fascicles surrounded by the epineural sheath can be recognized. For comparison, a transverse cross sectional image of non-tissue cleared, stained sciatic nerve is shown in (d); note that non-specific staining occurs in the epineurial sheath as well, but only the right portion of the sheath is observed. (e) Two-photon transverse cross sectional image of a sciatic nerve from a transgenic rat (thy-1 GFP).
Figure 2
Figure 2. Deep tissue and high resolution images of tissue cleared nerves by confocal microscopy following anti-neurofilament antibody labeling.
(a) Lateral (xy) confocal image. (b) Cross sectional image. The elongated shape of the axons in the z direction is caused by the lower relative axial resolution of confocal microscopy.
Figure 3
Figure 3. Cross sectional images of a wild-type, stained and tissue cleared sciatic nerve without physical sectioning.
The reconstructed cross sectional image of a healthy sciatic nerve from a rat at different locations from a point of reference to the distal end. The distance of each cross section from the initial slice is noted in each subsequent figure. Video S2 contains a flythrough animation.
Figure 4
Figure 4. Comparison of the signal intensities between both tissue-cleared GFP and antibody-stained, wild-type sciatic nerves.
(a) Tissue-cleared thy-1 GFP nerve (b) Tissue-cleared, wild type nerve following immunofluorescence staining. Note that both (a) and (b) cross sectional images are presented at slightly different magnification. Non-specific GFP labeling can be observed in (a) due to the ubiquitous expression of the thy-1 regulatory gene. Insets in (a) and (b) are intensity profiles of vertically elongated rectangular areas (along the z-axis). (c, d) Intensity profiles of horizontally elongated rectangular areas (along the x-axis) are also shown in images a and b, respectively. The vastly improved penetration depth provided by tissue clearing allows for visualization of axons throughout the nerve.
Figure 5
Figure 5. Time course study of sciatic nerves following neurorrhaphy.
(a, c, e, g) Large area, ex vivo images of wild type rat sciatic nerves that have undergone whole mount immunofluorescence staining and tissue clearing at 3, 6, 9 and 12 days post-neurorrhaphy obtained using confocal microscopy. In the figure, the proximal direction lies to the left of the repair site, while the distal direction lies to the right. (b, d, f, h) High-resolution images of the individual axons located approximately 2 mm to distal direction from the repair site in (a, c, e, g), respectively.
Figure 6
Figure 6. Z-stacked images for quantitative analysis of nerve degeneration and regeneration.
Wild type rat sciatic nerves were processed with whole mount immunofluorescence staining and tissue clearing. First row: z-stacked confocal images of tissue cleared sciatic nerves. Second row: Long axonal features representing both healthy and regenerating axons (green). Third row: Short axonal features representing degenerated axonal fragments and debris (red). Individual columns, moving left to right, correspond to different time points after neurorrhaphy. Scale bar is 50 μm.
Figure 7
Figure 7. Normalized length scores for transected nerves at time points following surgical repair.
The normalized value describing the amount of long axons was acquired from 32 datasets (200×200×24 μm3) at each time point taken 5 mm distal to the repair site, and indicated as black dots.
Figure 8
Figure 8. Example of walking track analysis obtained in wild type male Sprague Dawley rats after neurorrhaphy.
Consistent with published literature , the animal reaches approximately 60% of baseline function by 12 weeks with a peripheral nerve growth rate of approximately 3 mm per day . The sciatic functional index (SFI), a standard measure of functional recovery, is plotted along the y-axis, with a score of 0 representing a normal healthy nerve at baseline (top dotted line) and a score of −100 representing complete transection (bottom dotted line) .
Figure 9
Figure 9. Time course CARS microscopy of distal sciatic nerves following neurorrhaphy.
(a) At 3 days postoperatively, the myelin sheath anatomy suggests underlying structural chromatolysis and swelling of axons, continuing through day 6 (b). (c) At 9 days postoperatively, very little myelin signal is visualized as axons reach the nadir of degradation; macrophage-like cells with dark central nuclei begin to appear. (d) By 12 days postoperatively, lipid phagocytosis and possible metamorphosis of Schwann cells is observed. Double arrows denote myelin sheaths at early time points; the arrowhead denotes a macrophage-like cell at later time points.

References

    1. Isaacs J (2010) Treatment of acute peripheral nerve injuries: current concepts. The Journal of hand surgery 35: 491–497. - PubMed
    1. Wiberg M, Terenghi G (2003) Will it be possible to produce peripheral nerves? Surgical technology international 11: 303. - PubMed
    1. Birch R, Eardley WGP, Ramasamy A, Brown K, Shenoy R, et al. (2012) Nerve injuries sustained during warfare PART I - EPIDEMIOLOGY. Journal of Bone and Joint Surgery-British Volume 94B: 523–528. - PubMed
    1. Maricevic A, Erceg M (1997) War injuries to the extremities. Military medicine 162: 808–811. - PubMed
    1. Campbell WW (2008) Evaluation and management of peripheral nerve injury. Clinical neurophysiology 119: 1951–1965. - PubMed

Publication types