

Regulation of a transcription factor network by Cdk1 coordinates late cell cycle gene expression
- PMID: 24714560
- PMCID: PMC4193936
- DOI: 10.1002/embj.201386877
Regulation of a transcription factor network by Cdk1 coordinates late cell cycle gene expression
Abstract
To maintain genome stability, regulators of chromosome segregation must be expressed in coordination with mitotic events. Expression of these late cell cycle genes is regulated by cyclin-dependent kinase (Cdk1), which phosphorylates a network of conserved transcription factors (TFs). However, the effects of Cdk1 phosphorylation on many key TFs are not known. We find that elimination of Cdk1-mediated phosphorylation of four S-phase TFs decreases expression of many late cell cycle genes, delays mitotic progression, and reduces fitness in budding yeast. Blocking phosphorylation impairs degradation of all four TFs. Consequently, phosphorylation-deficient mutants of the repressors Yox1 and Yhp1 exhibit increased promoter occupancy and decreased expression of their target genes. Interestingly, although phosphorylation of the transcriptional activator Hcm1 on its N-terminus promotes its degradation, phosphorylation on its C-terminus is required for its activity, indicating that Cdk1 both activates and inhibits a single TF. We conclude that Cdk1 promotes gene expression by both activating transcriptional activators and inactivating transcriptional repressors. Furthermore, our data suggest that coordinated regulation of the TF network by Cdk1 is necessary for faithful cell division.
Figures


Expression of Hcm1-3N-3HA and Hcm1-8C-3HA over the cell cycle. Cells were arrested in G1, released into the cell cycle, and samples taken for Western blot and flow cytometry (Supplementary Fig S8A) at 15-min time points.
Cells expressing Hcm1-GFP or Hcm1-3N-GFP from the TEF1 promoter were arrested in G1 with alpha-factor, S-phase with HU, or mitosis with nocodazole and half-lives compared by cycloheximide-chase assay. Levels of Hcm1, Clb2, and cyclin-dependent kinase 1 (Cdk1) are shown. Cell cycle arrest was confirmed by flow cytometry (Supplementary Fig S8B).
Cells expressing the indicated Hcm1 mutants from the TEF1 promoter were arrested in mitosis (Supplementary Fig S8C) and half-lives compared by cycloheximide-chase assay. Two exposures of Hcm1 blots are shown to highlight differences in stability between the double phosphomutants.
Cycloheximide-chase assay of Hcm1(1-107)-GFP and Hcm1(1-107)3N-GFP fusion proteins in asynchronous cells.
CDC53, cdc53-1, sic1Δ CDC53, and sic1Δ cdc53-1 cells expressing Hcm1(1-107)-GFP were arrested in mitosis (Supplementary Fig S8D) at the permissive temperature, shifted to 37°C for 15 min, and half-lives compared by cycloheximide-chase assay.
Fivefold dilutions of cells with the indicated genotypes were spotted onto rich medium plates (YPD), or plates containing the indicated concentrations of benomyl.

Cells with the indicated genotypes were synchronized in late S-phase by arresting in G1 and collecting 45 min after release (Supplementary Fig S10A). Expression of target genes was compared by RT-qPCR. All values are normalized to ACT1 and shown relative to Hcm1 WT cells. Mean and standard deviations from technical replicates of a representative experiment are shown.
Fivefold dilutions of cells with the indicated genotypes were spotted onto rich medium plates (YPD), or plates containing 15 μg/ml benomyl.
ChIP-qPCR of V5-tagged Hcm1, Hcm1-8C, Hcm1-16E, and an untagged control from cells that were arrested in G1 and collected 37 min after release (Supplementary Fig S10B). Mean and standard deviations from three biological replicates are shown. For each primer set, binding is shown relative to Hcm1 wild-type.
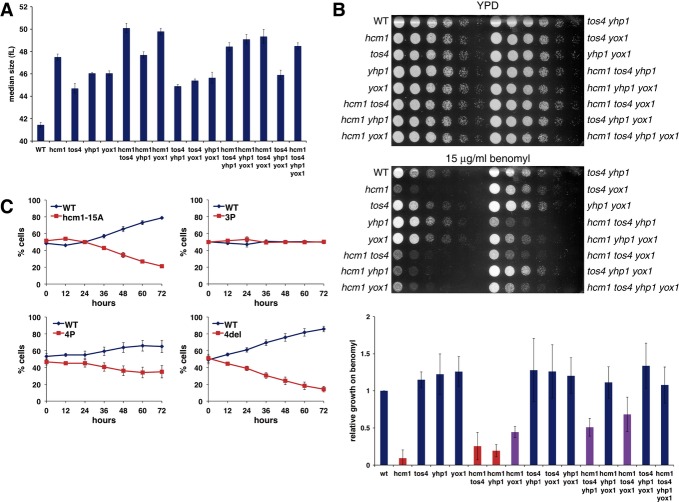
Median cell volume of asynchronous cultures carrying cyclin-dependent kinase (Cdk)- mutations in the indicated TFs. The mean and standard deviations from three independent experiments are graphed.
Fivefold dilution of cells from (A) were spotted onto rich medium plates (YPD), or plates containing 15 μg/ml benomyl (top). Growth on benomyl plates (at a sub-saturating dilution) was quantified with ImageJ and normalized to growth on YPD. Mean and standard deviations of relative growth from three independent experiments are graphed (bottom). Benomyl sensitive (red bars), wild-type sensitivity (blue bars), intermediate sensitivity (purple bars).
The percentage of cells in co-cultures of strains carrying PGK1-URA3 (blue lines) and PGK1-GFP-URA3 (red lines) were determined at the indicated time points. 4P, hcm1-15A tos4-9A yox1-9A yhp1-13A; 3P, tos4-9A yox1-9A yhp1-13A; 4del, hcm1Δ tos4Δ yox1Δ yhp1Δ. Mean and standard deviations of 4–6 experiments are shown.

References
-
- Agarwal R, Tang Z, Yu H, Cohen-Fix O. Two distinct pathways for inhibiting pds1 ubiquitination in response to DNA damage. J Biol Chem. 2003;278:45027–45033. - PubMed
-
- Benanti JA, Cheung SK, Brady MC, Toczyski DP. A proteomic screen reveals SCFGrr1 targets that regulate the glycolytic-gluconeogenic switch. Nat Cell Biol. 2007;9:1184–1191. - PubMed
MeSH terms
Substances
Grants and funding
LinkOut - more resources
Full Text Sources
Other Literature Sources
Molecular Biology Databases
Miscellaneous
