. 2014 Jul;24(7):1193-208.
doi: 10.1101/gr.171546.113. Epub 2014 Apr 8.

Natural variation in genome architecture among 205 Drosophila melanogaster Genetic Reference Panel lines

Affiliations

Natural variation in genome architecture among 205 Drosophila melanogaster Genetic Reference Panel lines

Wen Huang et al. Genome Res. 2014 Jul.

Abstract

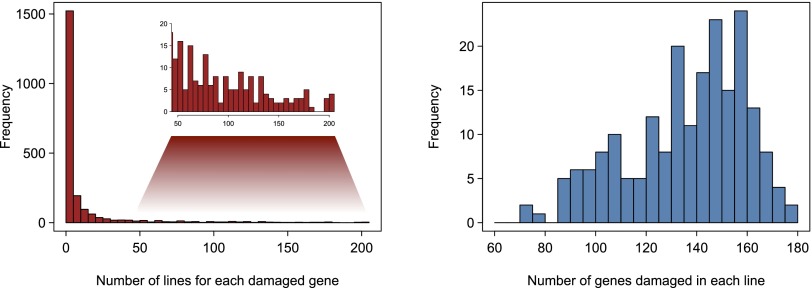
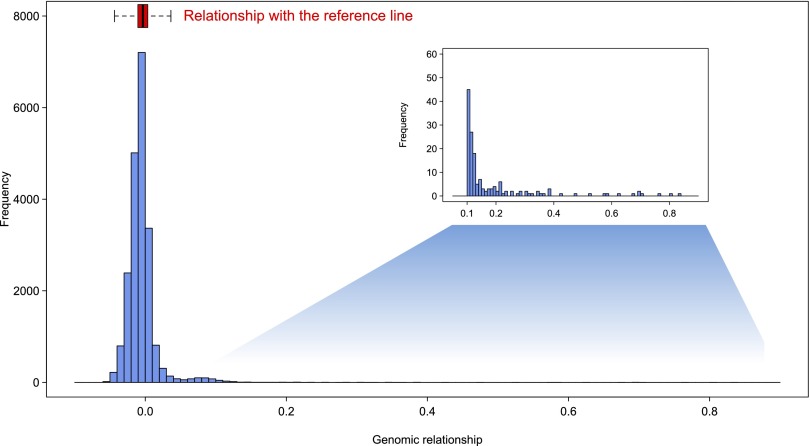
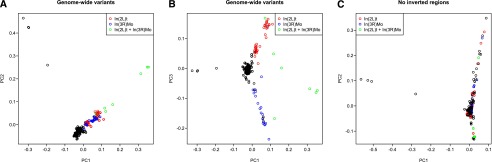
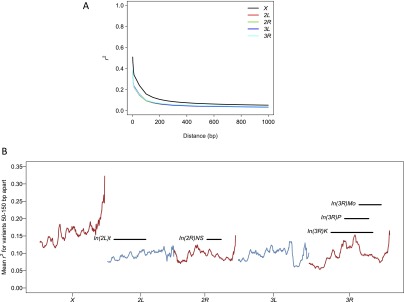
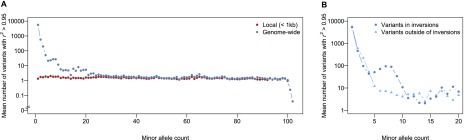
The Drosophila melanogaster Genetic Reference Panel (DGRP) is a community resource of 205 sequenced inbred lines, derived to improve our understanding of the effects of naturally occurring genetic variation on molecular and organismal phenotypes. We used an integrated genotyping strategy to identify 4,853,802 single nucleotide polymorphisms (SNPs) and 1,296,080 non-SNP variants. Our molecular population genomic analyses show higher deletion than insertion mutation rates and stronger purifying selection on deletions. Weaker selection on insertions than deletions is consistent with our observed distribution of genome size determined by flow cytometry, which is skewed toward larger genomes. Insertion/deletion and single nucleotide polymorphisms are positively correlated with each other and with local recombination, suggesting that their nonrandom distributions are due to hitchhiking and background selection. Our cytogenetic analysis identified 16 polymorphic inversions in the DGRP. Common inverted and standard karyotypes are genetically divergent and account for most of the variation in relatedness among the DGRP lines. Intriguingly, variation in genome size and many quantitative traits are significantly associated with inversions. Approximately 50% of the DGRP lines are infected with Wolbachia, and four lines have germline insertions of Wolbachia sequences, but effects of Wolbachia infection on quantitative traits are rarely significant. The DGRP complements ongoing efforts to functionally annotate the Drosophila genome. Indeed, 15% of all D. melanogaster genes segregate for potentially damaged proteins in the DGRP, and genome-wide analyses of quantitative traits identify novel candidate genes. The DGRP lines, sequence data, genotypes, quality scores, phenotypes, and analysis and visualization tools are publicly available.


Figures

Figure 1.
Figure 1.
Flowchart of the integrated genotyping procedure used to call SNP and non-SNP variants. Seven different variant calling methods were used to derive a consensus list of variant calls. The variant calls were grouped into haplotype bins (indicated by dashed vertical lines) such that there is a region on both sides of each region containing two or more regions of at least 110 bp with no non-SNP variants in any line. The variable regions and their 110-bp flanking regions were used to derive the sequences of alternative haplotypes against which reads are aligned. Finally, reads were aligned and genotypes called, followed by quality filtering that accounted for the experimental design.
Figure 2.
Figure 2.
Distributions of the percent segregating variants in 205 DGRP lines, by chromosome. The distributions for homozygous standard or inverted karyotypes are given in blue, and the distributions for inversion/standard heterozygotes are given in red.
Figure 3.
Figure 3.
Nonrandom distribution of variants. The average number of SNPs (y-axis) for each distance in bp (x-axis) from either side of a variant of high frequency (MAF 40%–50%). Solid lines represent the number of SNPs of a given range of allele counts in lines that have the variant in question, whereas dashed lines show the number of SNPs in lines that do not have the variant. (A) Indels. (B) Noncoding SNPs.
Figure 4.
Figure 4.
Nucleotide diversity (π) within standard karyotypes (blue bars), within inverted karyotypes (red bars), and between standard and inverted karyotypes (purple bars) within genomic regions encompassed by common polymorphic inversions. The calculation was based on nonmissing genotypes only, with indels (>1 bp) or multiple nucleotide polymorphisms receiving the same weight as SNPs regardless of their length.
Figure 5.
Figure 5.
Histograms of the numbers of DGRP lines containing each damaged gene (left) and the number of damaged genes per DGRP line (right).
Figure 6.
Figure 6.
Histogram of genomic relationships among DGRP lines (20,910 possible pairs). The distribution of the relationship between all DGRP lines and the reference sequence is displayed as a box plot.
Figure 7.
Figure 7.
Principal component analysis of DNA sequence variation in the DGRP. Principal components (PCs) are computed using EIGENSTRAT. (A) PC plot of PC1 versus PC2. (B) PC plot of PC1 versus PC3. (C) PC plot of PC1 versus PC2 after PCs were recomputed excluding all variants in regions encompassing major inversions (In[2L]t, In[2R]NS, In[3R]P, In[3R]K, In[3R]Mo). With the exception of four highly related pairs of lines, there is no apparent clustering of karyotype groups.
Figure 8.
Figure 8.
Patterns of LD. (A) Decay in LD with physical distance, by chromosome arm. (B) Genome-wide spatial variation in LD. Mean r2 between variants within 50–150 bp of each other in sliding windows (in 100-kb steps) of 1 Mb is plotted.
Figure 9.
Figure 9.
Relationship between LD and minor allele count. For each of the minor allele counts, 1000 random variants are sampled, and the mean number of variants genome-wide or locally (<1 kb) in strong LD (r2 > 0.95) with the focal variant is calculated. (A) Relationship between the mean number of variants in strong LD with the focal variant and minor allele count. (B) Relationship between the mean number of variants in strong LD with the focal variant and minor allele count, stratified according to the location of the focal variant (within or outside of inversions).

References

    1. Abyzov A, Urban AE, Snyder M, Gerstein M 2011. CNVnator: an approach to discover, genotype and characterize typical and atypical CNVs from family and population genome sequencing. Genome Res 21: 974–984 - PMC - PubMed
    1. Alkan C, Coe BP, Eichler EE 2011. Genome structural variation discovery and genotyping. Nat Rev Genet 12: 363–376 - PMC - PubMed
    1. Andolfatto P, Depaulis F, Navarro A 2001. Inversion polymorphisms and nucleotide variability in Drosophila. Genet Res 77: 1–8 - PubMed
    1. Assis R, Kondrashov AS 2012. A strong deletion bias in nonallelic gene conversion. PLoS Genet 8: e1002508. - PMC - PubMed
    1. Astle W, Balding DJ 2009. Population structure and cryptic relatedness in genetic association studies. Stat Sci 24: 451–471

Publication types

MeSH terms

LinkOut - more resources