Nature and mechanisms of hepatocyte apoptosis induced by D-galactosamine/lipopolysaccharide challenge in mice
- PMID: 24714963
- PMCID: PMC4055346
- DOI: 10.3892/ijmm.2014.1730
Nature and mechanisms of hepatocyte apoptosis induced by D-galactosamine/lipopolysaccharide challenge in mice
Abstract
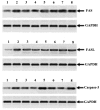
Apoptosis plays a role in the normal development of liver. However, overactivation thereof may lead to hepatocellular damage. The aim of this study was to assess D-galactosamine (D-GalN)/lipopolysaccharide (LPS)-induced hepatocyte apoptotic changes in mice and clarify the mechanisms involved in this process. DNA ladder detection was employed to determine the induction condition of hepatic apoptosis. An initial test indicated that typical hepatocyte apoptosis was observed at 6-10 h after the intraperitoneal injection of D-GalN (700 mg/kg) and LPS (10 µg/kg). Subsequently, we evaluated hepatocyte apoptosis at 8 h after administering D-GalN/LPS by histopathological analysis, terminal deoxynucleotidyl transferase-mediated dUTP nick end‑labeling (TUNEL) detection, flow cytometry and electron microscopy analysis. To clarify the apoptosis-related gene expression, the expression levels of tumor necrosis factor-α (TNF-α), transforming growth factor-β1 (TGF-β1), caspase-3, and Fas/Fas ligand (FasL) were determined by serum enzyme immunoassay, immunohistochemistry and western blot analysis. Strong apoptotic positive signals following D-GalN/LPS injection were observed from the results of the serum analysis, histopathological and immunohistochemical analyses, DNA ladder detection, TUNEL detection, flow cytometry and electron microscopy analysis. Additionally, apoptotic hepatocytes were mainly at the late stage of cell apoptosis. The expression of TNF-α, TGF-β1, caspase-3 and Fas/FasL was significantly increased. In conclusion, this study evaluated the D-GalN/LPS-induced hepatocyte apoptotic changes and clarified the apoptosis-related gene expression in mice. The hepatocyte apoptosis induced by D-GalN/LPS may be mainly regulated by the death receptor pathway. TGF-β signaling pathway may also play a vital role in this process of hepatocyte apoptosis.
Figures


Similar articles
-
Genipin protects lipopolysaccharide-induced apoptotic liver damage in D-galactosamine-sensitized mice.Eur J Pharmacol. 2010 Jun 10;635(1-3):188-93. doi: 10.1016/j.ejphar.2010.03.007. Epub 2010 Mar 19. Eur J Pharmacol. 2010. PMID: 20303938
-
Protective effect of linarin against D-galactosamine and lipopolysaccharide-induced fulminant hepatic failure.Eur J Pharmacol. 2014 Sep 5;738:66-73. doi: 10.1016/j.ejphar.2014.05.024. Epub 2014 May 27. Eur J Pharmacol. 2014. PMID: 24877692
-
A role of cell apoptosis in lipopolysaccharide (LPS)-induced nonlethal liver injury in D-galactosamine (D-GalN)-sensitized rats.Dig Dis Sci. 2008 May;53(5):1316-24. doi: 10.1007/s10620-007-9994-y. Epub 2007 Oct 13. Dig Dis Sci. 2008. PMID: 17934810
-
Mechanism for hepato-protective action of Liangxue Huayu Recipe (LHR): blockade of mitochondrial cytochrome c release and caspase activation.J Ethnopharmacol. 2013 Jul 30;148(3):851-60. doi: 10.1016/j.jep.2013.05.024. Epub 2013 May 24. J Ethnopharmacol. 2013. PMID: 23711831
-
Hepatoprotective effects of cathepsin B inhibitor on acute hepatic failure induced by lipopolysaccharide/D-galactosamine in mice.Hepatobiliary Pancreat Dis Int. 2013 Feb;12(1):80-6. doi: 10.1016/s1499-3872(13)60010-7. Hepatobiliary Pancreat Dis Int. 2013. PMID: 23392803
Cited by
-
The Effects of Apocynin on Monosodium Glutamate Induced Liver Damage of Rats.Heliyon. 2023 Jun 15;9(7):e17327. doi: 10.1016/j.heliyon.2023.e17327. eCollection 2023 Jul. Heliyon. 2023. PMID: 37449146 Free PMC article.
-
Protective Effects of Costunolide Against D-Galactosamine and Lipopolysaccharide-Induced Acute Liver Injury in Mice.Front Pharmacol. 2018 Dec 20;9:1469. doi: 10.3389/fphar.2018.01469. eCollection 2018. Front Pharmacol. 2018. PMID: 30618760 Free PMC article.
-
System Biology Investigation Revealed Lipopolysaccharide and Alcohol-Induced Hepatocellular Carcinoma Resembled Hepatitis B Virus Immunobiology and Pathogenesis.Int J Mol Sci. 2023 Jul 6;24(13):11146. doi: 10.3390/ijms241311146. Int J Mol Sci. 2023. PMID: 37446321 Free PMC article.
-
Oyster-Derived Tyr-Ala (YA) Peptide Prevents Lipopolysaccharide/D-Galactosamine-Induced Acute Liver Failure by Suppressing Inflammatory, Apoptotic, Ferroptotic, and Pyroptotic Signals.Mar Drugs. 2021 Oct 28;19(11):614. doi: 10.3390/md19110614. Mar Drugs. 2021. PMID: 34822485 Free PMC article.
-
Investigation of Metabolome Underlying the Biological Mechanisms of Acute Heat Stressed Granulosa Cells.Int J Mol Sci. 2022 Feb 15;23(4):2146. doi: 10.3390/ijms23042146. Int J Mol Sci. 2022. PMID: 35216260 Free PMC article.
References
-
- White E. Death-defying acts: a meeting review on apoptosis. Genes Dev. 1993;7:2277–2284. - PubMed
-
- Patel T, Gores GJ. Apoptosis and hepatobiliary disease. Hepatology. 1995;21:1725–1741. - PubMed
-
- Eichhorst ST. Modulation of apoptosis as a target for liver disease. Expert Opin Ther Targets. 2005;9:83–89. - PubMed
-
- Prétet JL, Pelletier L, Bernard B, Coumes-Marquet S, Kantelip B, Mougin C. Apoptosis participates to liver damage in HSV induced fulminant hepatitis. Apoptosis. 2003;8:655–663. - PubMed
-
- Keppler D, Lesch R, Reutter W, Decker K. Experimental hepatitis induced by d-galactosamine. Exp Mol Pathol. 1968;9:279–290. - PubMed
Publication types
MeSH terms
Substances
LinkOut - more resources
Full Text Sources
Other Literature Sources
Research Materials
Miscellaneous

