Electronic polarization stabilizes tertiary structure prediction of HP-36
- PMID: 24715046
- PMCID: PMC3996369
- DOI: 10.1007/s00894-014-2195-7
Electronic polarization stabilizes tertiary structure prediction of HP-36
Abstract
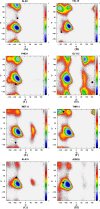
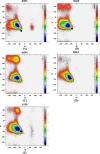
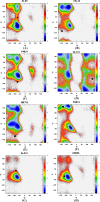
Molecular dynamic (MD) simulations with both implicit and explicit solvent models have been carried out to study the folding dynamics of HP-36 protein. Starting from the extended conformation, the secondary structure of all three helices in HP-36 was formed in about 50 ns and remained stable in the remaining simulation. However, the formation of the tertiary structure was difficult. Although some intermediates were close to the native structure, the overall conformation was not stable. Further analysis revealed that the large structure fluctuation of loop and hydrophobic core regions was devoted mostly to the instability of the structure during MD simulation. The backbone root-mean-square deviation (RMSD) of the loop and hydrophobic core regions showed strong correlation with the backbone RMSD of the whole protein. The free energy landscape indicated that the distribution of main chain torsions in loop and turn regions was far away from the native state. Starting from an intermediate structure extracted from the initial AMBER simulation, HP-36 was found to generally fold to the native state under the dynamically adjusted polarized protein-specific charge (DPPC) simulation, while the peptide did not fold into the native structure when AMBER force filed was used. The two best folded structures were extracted and taken into further simulations in water employing AMBER03 charge and DPPC for 25 ns. Result showed that introducing polarization effect into interacting potential could stabilize the near-native protein structure.
Figures


Similar articles
-
Hydrophobic core formation and dehydration in protein folding studied by generalized-ensemble simulations.Biophys J. 2010 Sep 8;99(5):1637-44. doi: 10.1016/j.bpj.2010.06.045. Biophys J. 2010. PMID: 20816077 Free PMC article.
-
Exploration of the secondary structure specific differential solvation dynamics between the native and molten globule states of the protein HP-36.J Phys Chem B. 2006 Oct 19;110(41):20629-34. doi: 10.1021/jp0633547. J Phys Chem B. 2006. PMID: 17034252
-
Microsecond scale replica exchange molecular dynamic simulation of villin headpiece: an insight into the folding landscape.J Biomol Struct Dyn. 2011 Jun;28(6):845-60. doi: 10.1080/07391102.2011.10508612. J Biomol Struct Dyn. 2011. PMID: 21469746
-
Contact pair dynamics during folding of two small proteins: chicken villin head piece and the Alzheimer protein beta-amyloid.J Chem Phys. 2004 Jan 15;120(3):1602-12. doi: 10.1063/1.1633253. J Chem Phys. 2004. PMID: 15268287
-
Dynamical spectroscopy and microscopy of proteins in cells.Curr Opin Struct Biol. 2021 Oct;70:1-7. doi: 10.1016/j.sbi.2021.02.001. Epub 2021 Mar 1. Curr Opin Struct Biol. 2021. PMID: 33662744 Review.
Cited by
-
Large-scale molecular dynamics simulation: Effect of polarization on thrombin-ligand binding energy.Sci Rep. 2016 Aug 10;6:31488. doi: 10.1038/srep31488. Sci Rep. 2016. PMID: 27507430 Free PMC article.
-
An Ab Initio QM/MM Study of the Electrostatic Contribution to Catalysis in the Active Site of Ketosteroid Isomerase.Molecules. 2018 Sep 20;23(10):2410. doi: 10.3390/molecules23102410. Molecules. 2018. PMID: 30241317 Free PMC article.
-
Trypsin-Ligand binding affinities calculated using an effective interaction entropy method under polarized force field.Sci Rep. 2017 Dec 18;7(1):17708. doi: 10.1038/s41598-017-17868-z. Sci Rep. 2017. PMID: 29255159 Free PMC article.
-
Prediction of membrane separation efficiency for hydrophobic and hydrophilic proteins : A coarse-grained Brownian dynamics simulation study.J Mol Model. 2019 Apr 25;25(5):132. doi: 10.1007/s00894-019-3985-8. J Mol Model. 2019. PMID: 31025120
-
Effect of polarization on HIV-1protease and fluoro-substituted inhibitors binding energies by large scale molecular dynamics simulations.Sci Rep. 2017 Feb 3;7:42223. doi: 10.1038/srep42223. Sci Rep. 2017. PMID: 28155907 Free PMC article.
References
-
- Kubelka J, Hofrichter J, Eaton WA. The protein folding ‘speed limit’. Curr Opin Struct Biol. 2004;14(1):76–88. - PubMed
-
- Wang JA, Zhu WL, Li GH, Hansmann UHE. Velocity-scaling optimized replica exchange molecular dynamics of proteins in a hybrid explicit/implicit solvent. J Chem Phys. 2011;135(8):084115. - PubMed
-
- Best RB, Mittal J. Balance between α and β structures in Ab initio protein folding. J Phys Chem B. 2010;114:8790–8798. - PubMed
-
- Duan Y, Kollman PA. Pathways to a protein folding intermediate observed in a 1-microsecond simulation in aqueous solution. Science. 1998;282(5389):740–744. - PubMed
-
- Shen MY, Freed KF. All-atom fast protein folding simulations: the villin headpiece. Proteins Struct Funct Genet. 2002;49(4):439–445. - PubMed
Publication types
MeSH terms
Substances
LinkOut - more resources
Full Text Sources
Other Literature Sources
Research Materials
Miscellaneous

