

Generation of functional cholangiocyte-like cells from human pluripotent stem cells and HepaRG cells
- PMID: 24715669
- PMCID: PMC4315871
- DOI: 10.1002/hep.27165
Generation of functional cholangiocyte-like cells from human pluripotent stem cells and HepaRG cells
Abstract
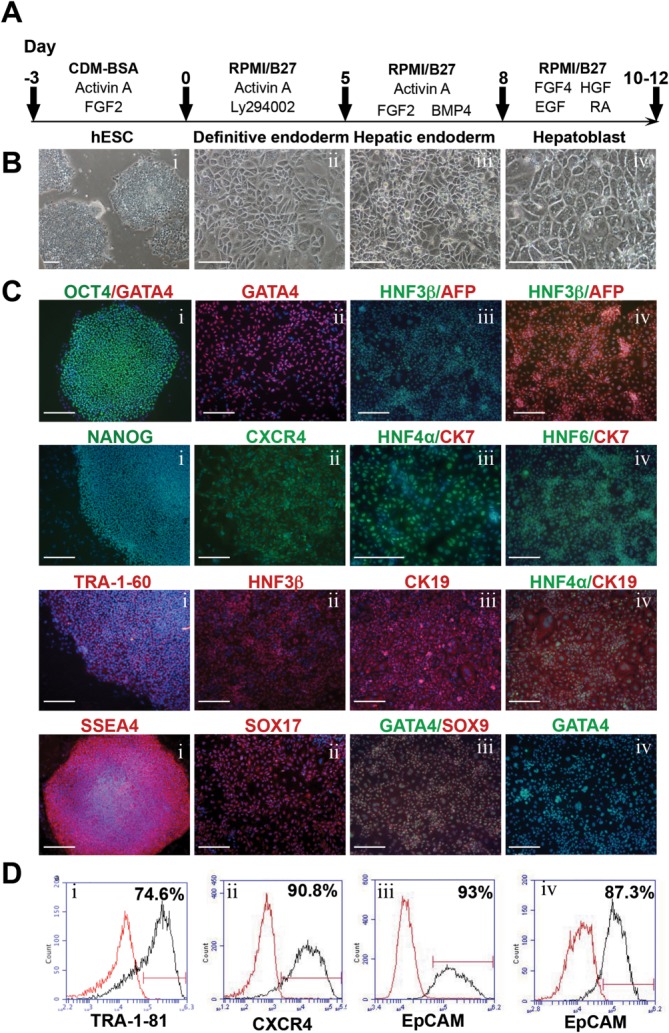
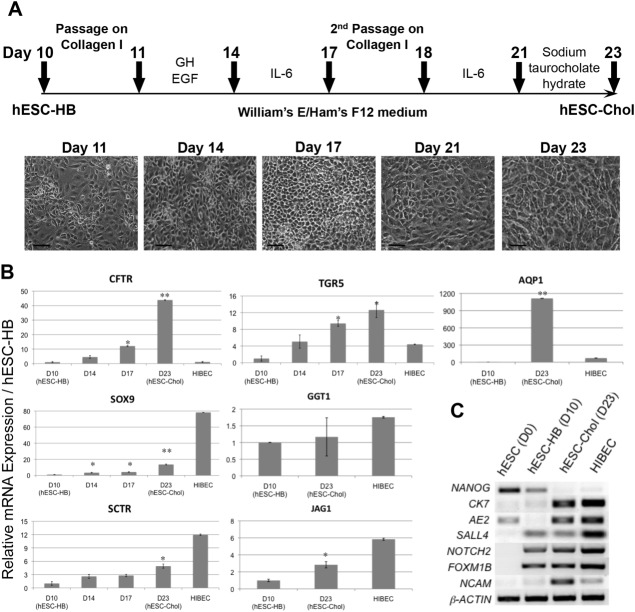
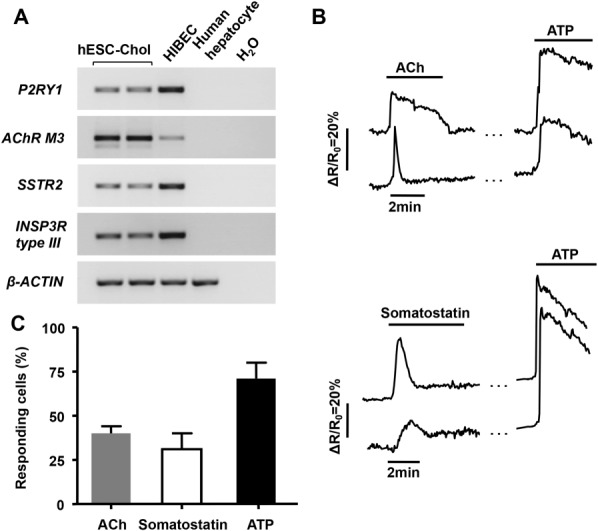
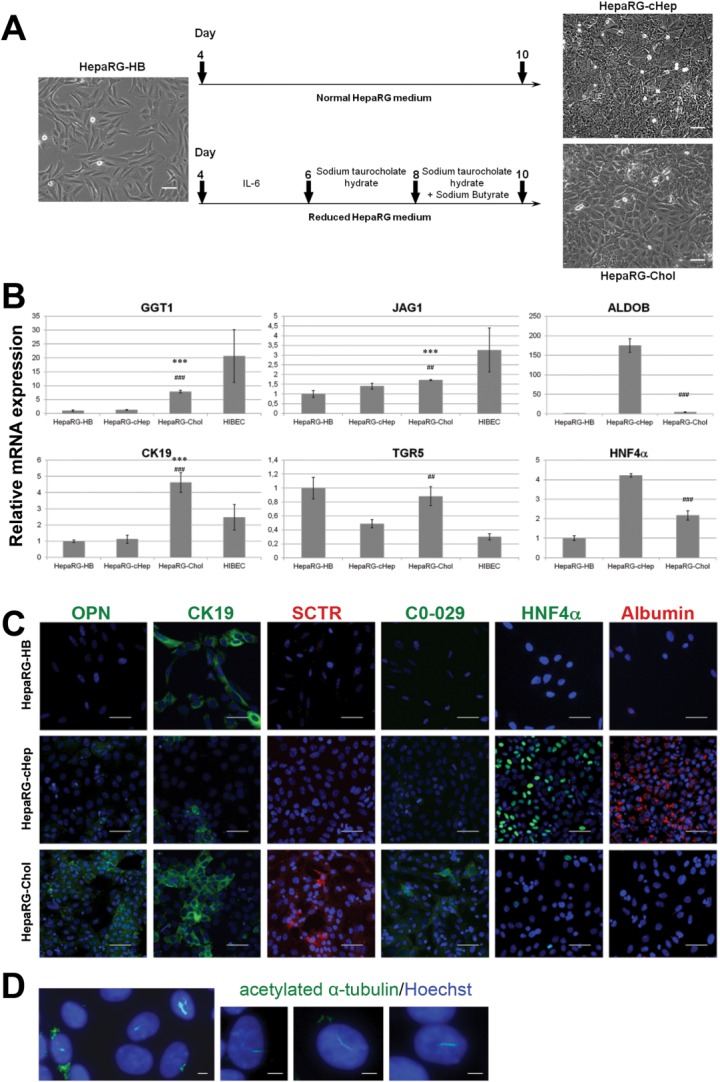
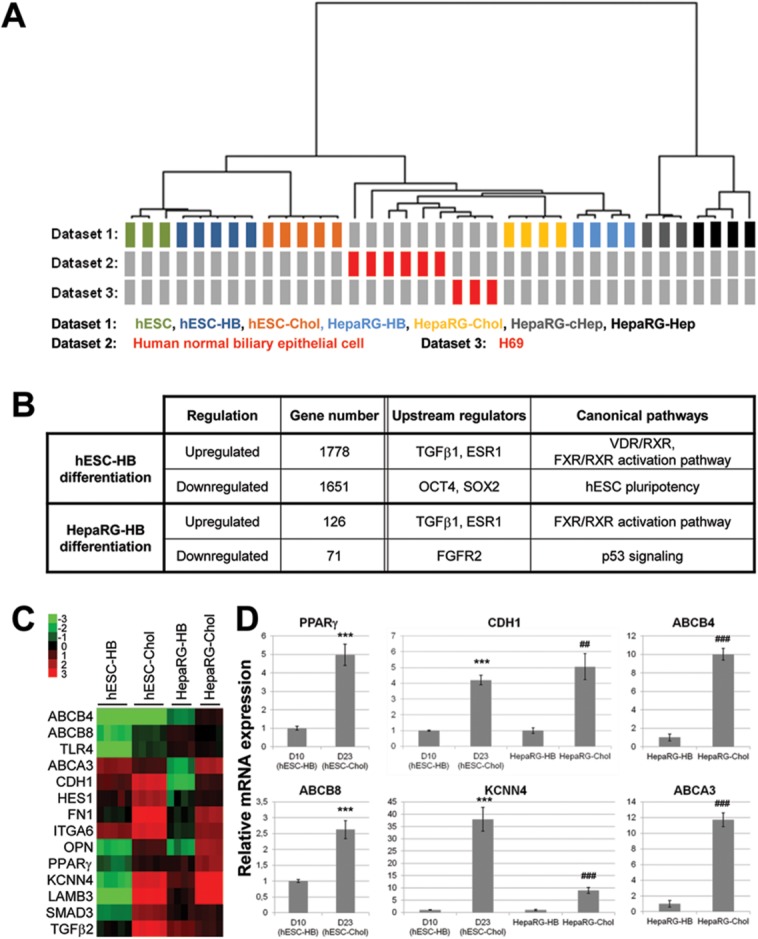
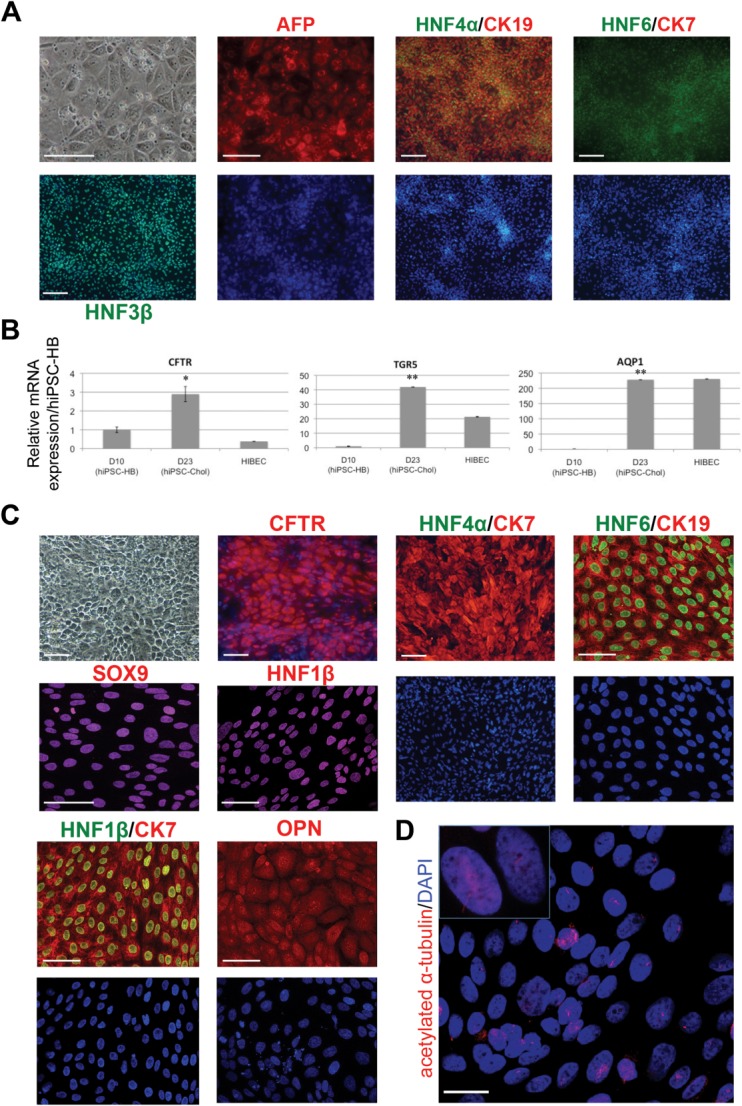
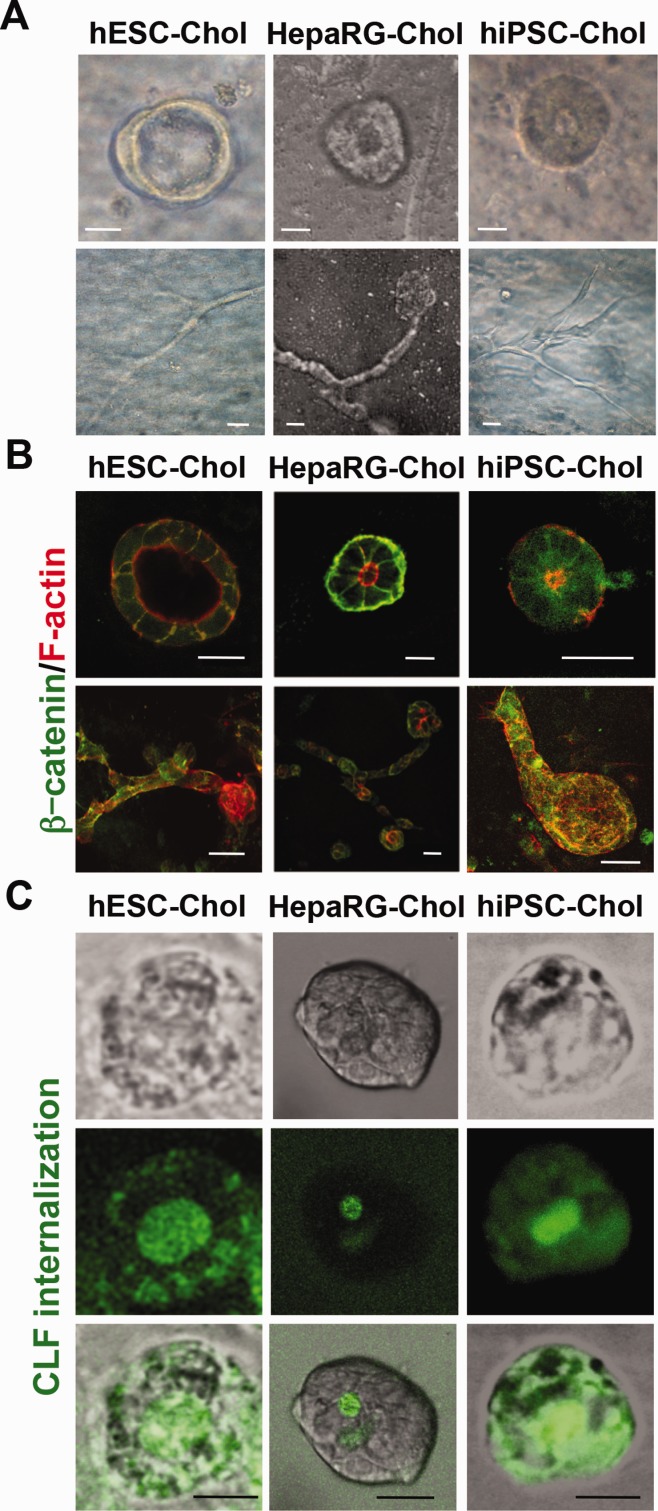
Cholangiocytes are biliary epithelial cells, which, like hepatocytes, originate from hepatoblasts during embryonic development. In this study we investigated the potential of human embryonic stem cells (hESCs) to differentiate into cholangiocytes and we report a new approach, which drives differentiation of hESCs toward the cholangiocytic lineage using feeder-free and defined culture conditions. After differentiation into hepatic progenitors, hESCs were differentiated further into cholangiocytes using growth hormone, epidermal growth factor, interleukin-6, and then sodium taurocholate. These conditions also allowed us to generate cholangiocytes from HepaRG-derived hepatoblasts. hESC- and HepaRG-derived cholangiocyte-like cells expressed markers of cholangiocytes including cytokeratin 7 and osteopontin, and the transcription factors SOX9 and hepatocyte nuclear factor 6. The cells also displayed specific proteins important for cholangiocyte functions including cystic fibrosis transmembrane conductance regulator, secretin receptor, and nuclear receptors. They formed primary cilia and also responded to hormonal stimulation by increase of intracellular Ca(2+) . We demonstrated by integrative genomics that the expression of genes, which signed hESC- or HepaRG-cholangiocytes, separates hepatocytic lineage from cholangiocyte lineage. When grown in a 3D matrix, cholangiocytes developed epithelial/apicobasal polarity and formed functional cysts and biliary ducts. In addition, we showed that cholangiocyte-like cells could also be generated from human induced pluripotent stem cells, demonstrating the efficacy of our approach with stem/progenitor cells of diverse origins.
Conclusion: We have developed a robust and efficient method for differentiating pluripotent stem cells into cholangiocyte-like cells, which display structural and functional similarities to bile duct cells in normal liver. These cells will be useful for the in vitro study of the molecular mechanisms of bile duct development and have important potential for therapeutic strategies, including bioengineered liver approaches.
Copyright © 2014 The Authors. HEPATOLOGY published by Wiley on behalf of the American Association for the Study of Liver Diseases.
Figures

Similar articles
-
Liver progenitor cells develop cholangiocyte-type epithelial polarity in three-dimensional culture.Mol Biol Cell. 2007 Apr;18(4):1472-9. doi: 10.1091/mbc.e06-09-0848. Epub 2007 Feb 21. Mol Biol Cell. 2007. PMID: 17314404 Free PMC article.
-
Feeder-free and serum-free production of hepatocytes, cholangiocytes, and their proliferating progenitors from human pluripotent stem cells: application to liver-specific functional and cytotoxic assays.Cell Reprogram. 2012 Apr;14(2):171-85. doi: 10.1089/cell.2011.0064. Epub 2012 Mar 2. Cell Reprogram. 2012. PMID: 22384928
-
Hepatic biliary epithelial cells acquire epithelial integrity but lose plasticity to differentiate into hepatocytes in vitro during development.J Cell Sci. 2013 Nov 15;126(Pt 22):5239-46. doi: 10.1242/jcs.133082. Epub 2013 Sep 17. J Cell Sci. 2013. PMID: 24046446
-
Human pluripotent stem cell-derived cholangiocytes: current status and future applications.Curr Opin Gastroenterol. 2015 May;31(3):233-8. doi: 10.1097/MOG.0000000000000180. Curr Opin Gastroenterol. 2015. PMID: 25850348 Review.
-
[Robust differentiation of fetal hepatocytes from human embryonic stem cells and iPS].Med Sci (Paris). 2010 Dec;26(12):1061-6. doi: 10.1051/medsci/201026121061. Med Sci (Paris). 2010. PMID: 21187045 Review. French.
Cited by
-
De novo HAPLN1 expression hallmarks Wnt-induced stem cell and fibrogenic networks leading to aggressive human hepatocellular carcinomas.Oncotarget. 2016 Jun 28;7(26):39026-39043. doi: 10.18632/oncotarget.9346. Oncotarget. 2016. PMID: 27191501 Free PMC article.
-
3D organoid cultivation improves the maturation and functional differentiation of cholangiocytes from human pluripotent stem cells.Front Cell Dev Biol. 2024 Jul 8;12:1361084. doi: 10.3389/fcell.2024.1361084. eCollection 2024. Front Cell Dev Biol. 2024. PMID: 39040044 Free PMC article.
-
Biliary epithelial cell differentiation of bipotent human liver-derived organoids by 2D and 3D culture.Biochem Biophys Rep. 2023 Jan 21;33:101432. doi: 10.1016/j.bbrep.2023.101432. eCollection 2023 Mar. Biochem Biophys Rep. 2023. PMID: 36714539 Free PMC article.
-
Bioengineering Liver Organoids for Diseases Modelling and Transplantation.Bioengineering (Basel). 2022 Dec 13;9(12):796. doi: 10.3390/bioengineering9120796. Bioengineering (Basel). 2022. PMID: 36551002 Free PMC article. Review.
-
The Potential Clinical Use of Stem/Progenitor Cells and Organoids in Liver Diseases.Cells. 2022 Apr 21;11(9):1410. doi: 10.3390/cells11091410. Cells. 2022. PMID: 35563716 Free PMC article. Review.
References
-
- Schmelzer E, Wauthier E, Reid LM. The phenotypes of pluripotent human hepatic progenitors. Stem Cells. 2006;24:1852–1858. - PubMed
-
- Zhang L, Theise N, Chua M, Reid LM. The stem cell niche of human livers: symmetry between development and regeneration. Hepatology. 2008;48:1598–1607. - PubMed
-
- Leite MF, Nathanson MH. Signaling pathways in biliary epithelial cells. In: Dufour J-F, Clavien P-A, Trautwein C, Graf R, editors. Signaling pathways in liver diseases. Berlin, Heidelberg: Springer; 2005.
Publication types
MeSH terms
Substances
LinkOut - more resources
Full Text Sources
Other Literature Sources
Molecular Biology Databases
Research Materials
Miscellaneous