Clinical Trial
. 2014 Apr;32(4):983-97.
doi: 10.1002/stem.1619.

Neoplastic reprogramming of patient-derived adipose stem cells by prostate cancer cell-associated exosomes

Affiliations
Clinical Trial

Neoplastic reprogramming of patient-derived adipose stem cells by prostate cancer cell-associated exosomes

Zakaria Y Abd Elmageed et al. Stem Cells. 2014 Apr.

Abstract

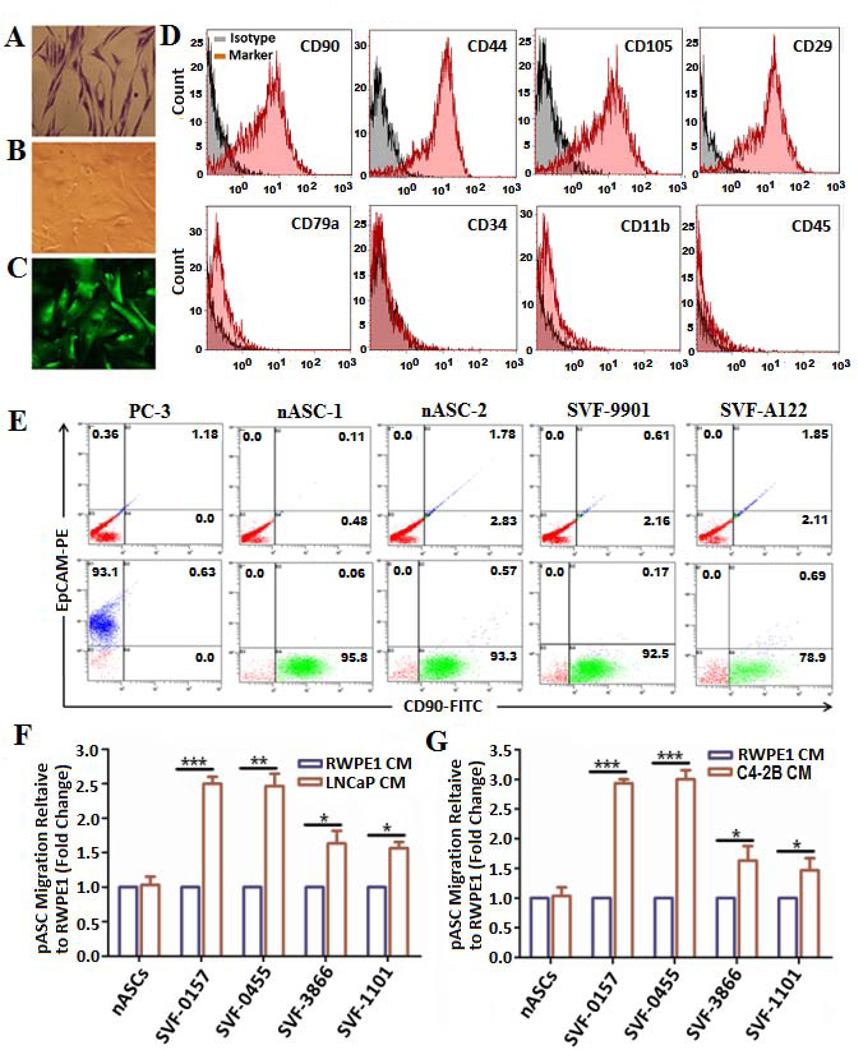
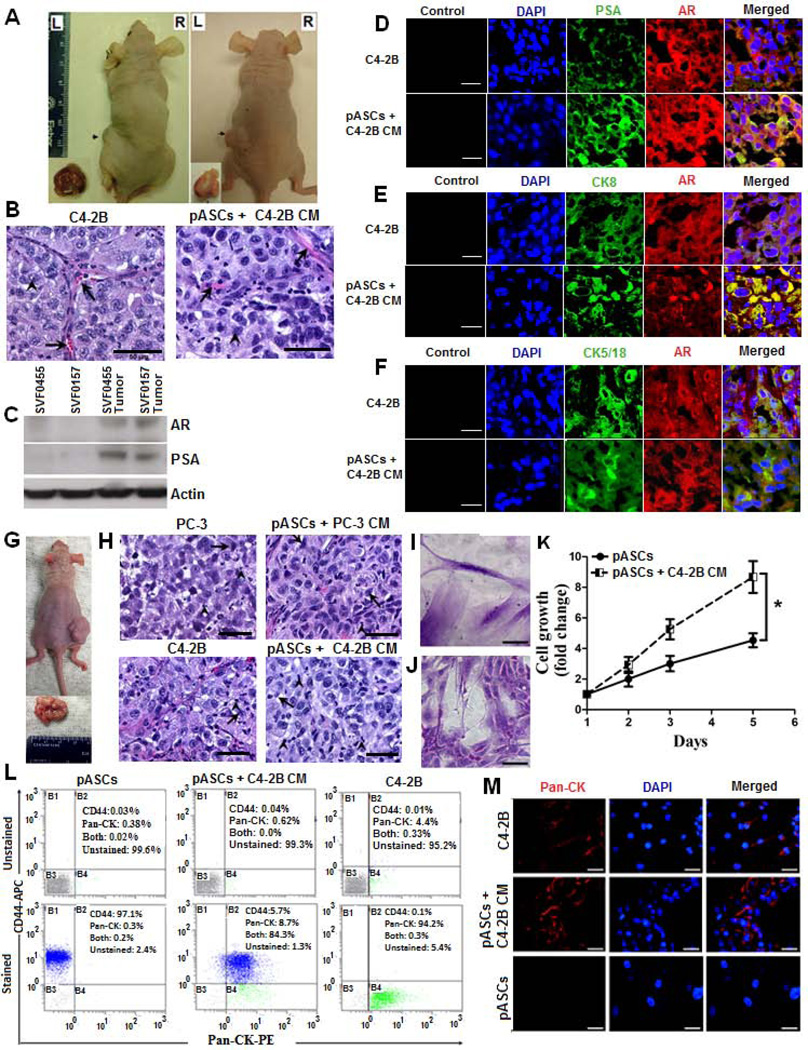
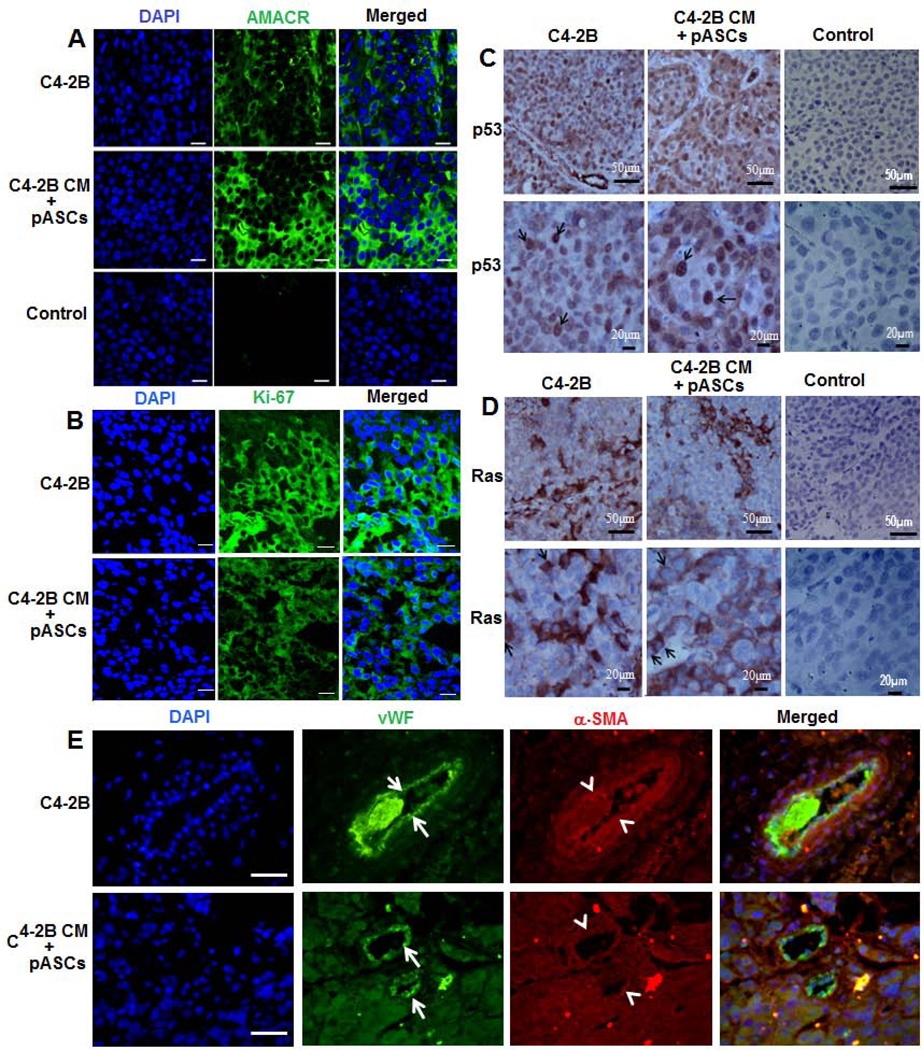
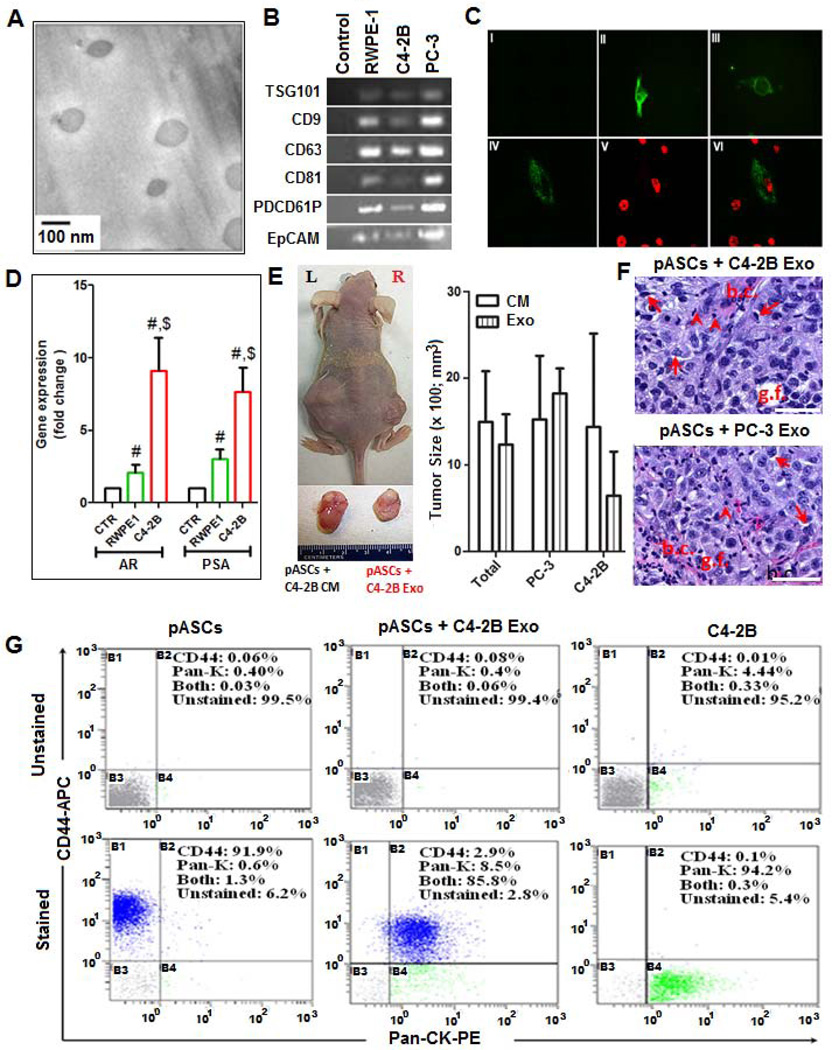
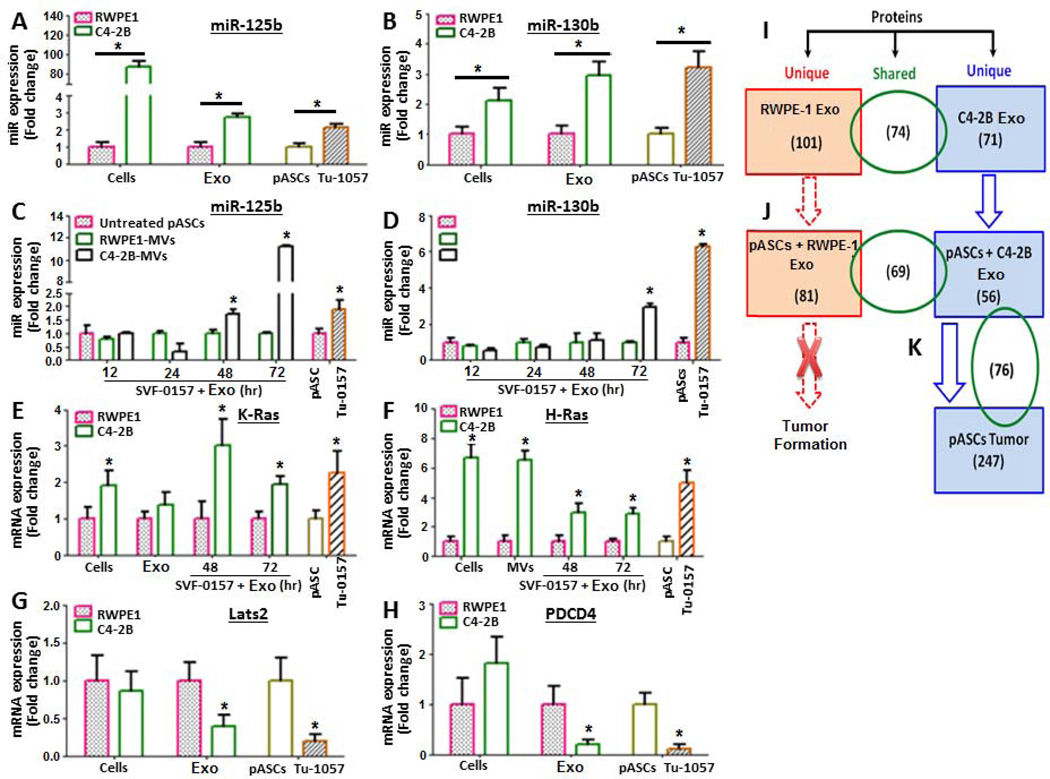
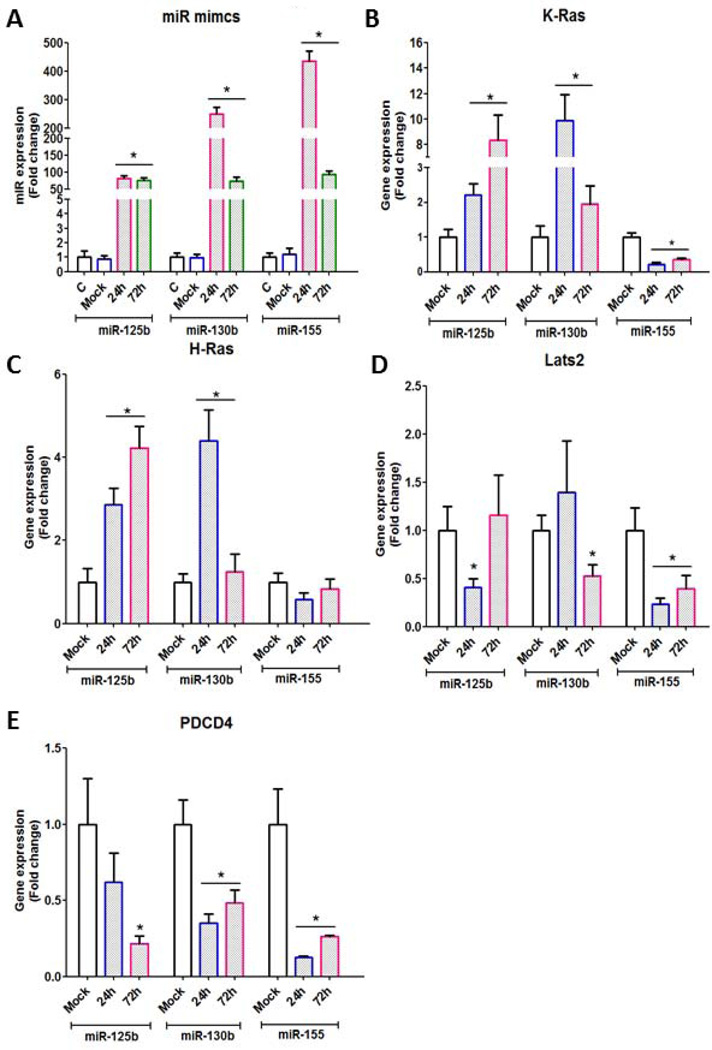
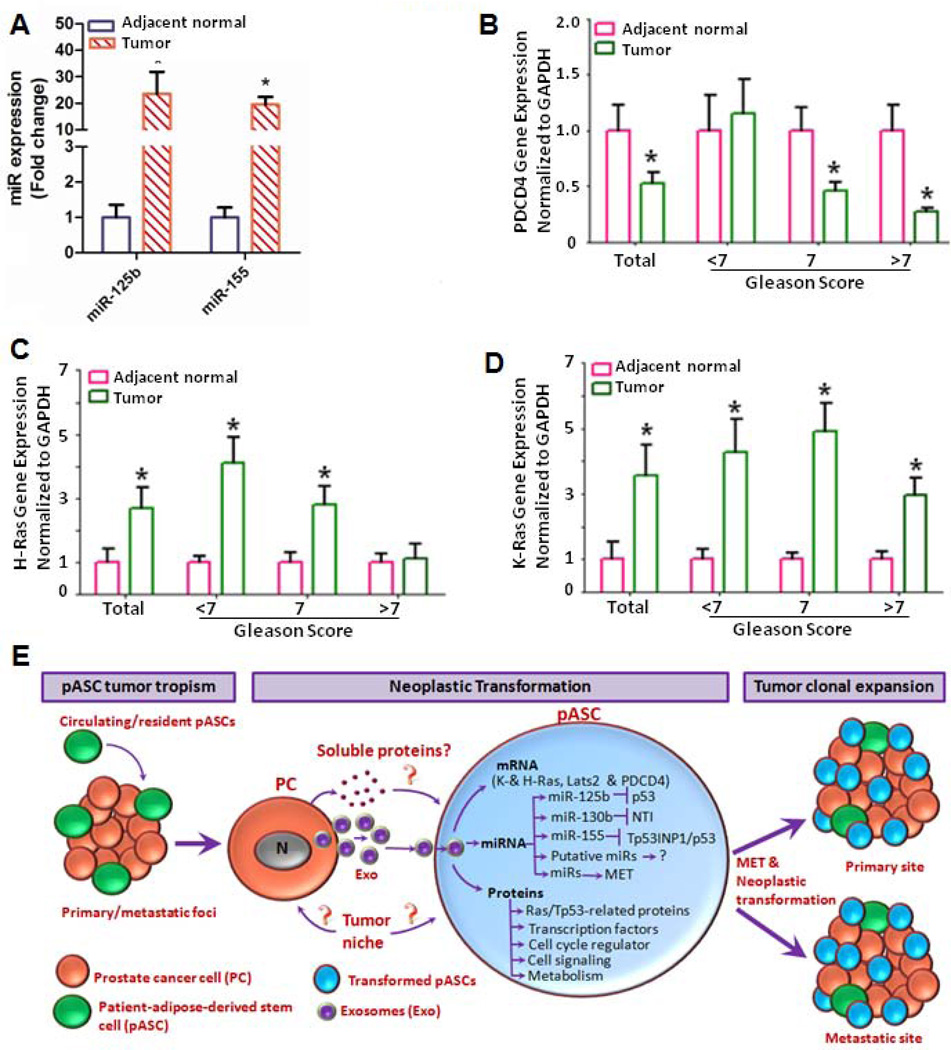
Emerging evidence suggests that mesenchymal stem cells (MSCs) are often recruited to tumor sites but their functional significance in tumor growth and disease progression remains elusive. Herein we report that prostate cancer (PC) cell microenvironment subverts PC patient adipose-derived stem cells (pASCs) to undergo neoplastic transformation. Unlike normal ASCs, the pASCs primed with PC cell conditioned media (CM) formed prostate-like neoplastic lesions in vivo and reproduced aggressive tumors in secondary recipients. The pASC tumors acquired cytogenetic aberrations and mesenchymal-to-epithelial transition and expressed epithelial, neoplastic, and vasculogenic markers reminiscent of molecular features of PC tumor xenografts. Our mechanistic studies revealed that PC cell-derived exosomes are sufficient to recapitulate formation of prostate tumorigenic mimicry generated by CM-primed pASCs in vivo. In addition to downregulation of the large tumor suppressor homolog2 and the programmed cell death protein 4, a neoplastic transformation inhibitor, the tumorigenic reprogramming of pASCs was associated with trafficking by PC cell-derived exosomes of oncogenic factors, including H-ras and K-ras transcripts, oncomiRNAs miR-125b, miR-130b, and miR-155 as well as the Ras superfamily of GTPases Rab1a, Rab1b, and Rab11a. Our findings implicate a new role for PC cell-derived exosomes in clonal expansion of tumors through neoplastic reprogramming of tumor tropic ASCs in cancer patients.

Keywords: Exosomes; OncomiRNAs; Patient adipose derived stem cells; Prostate cancer; Tumor mimicry.


Conflict of interest statement

DISCLOSURE of POTENTIAL CONFLICTS of INTREST

The authors declare no conflict of interest.

Figures

Figure 1
Figure 1. Isolation, characterization and transendothelial migration of patient-derived ASCs towards PC cell-CM in vitro
Representative photomicrographs of methylene blue stained patient-derived ASCs (pASCs) depicting retention of fibroblast-like phenotype (A) in comparison to parental cells stably transduced with a lentivirus construct expressing green fluorescent protein (pLV-eGFP) under bright field (B) and fluorescence microscope (C) (40x). (D) Purity of isolated pASCs was verified by FACS analysis of mesenchymal surface expression markers CD90, CD44, CD105, and CD29 (upper panel) and of hematopoietic lineage markers CD79α, CD34, CD11b, and CD45 (lower panel) compared with their isotype controls. (E) Representative FACS analysis of CD90-FITC and the epithelial marker EpCAM-PE to determine purity of pASCs (designated SVF-9901 and SVF-A122) against normal ASCs (nASC-1 and nASC-2) and PC-3 cells (lower panel) versus control isotype (upper panel). (F, G) Transendothelial migration of pLV-eGFP-labeled nASCs and pASCs (SVF-0157, SVF-0455, SVF-3866, and SVF-1101) through a confluent layer of hBMEC-1/basement membrane barrier towards CM of LNCaP, C4-2B, or RWPE-1 cells in the lower chambers. The pASCs migration was monitored in quadruplicates after 24 h by a fluorescence plate reader, normalized to RWPE-1 cells and expressed as a fold change in fluorescence intensity relative to nASCs by three independent experiments. * p<0.05, **p<0.01 and *** p<0.001.
Figure 2
Figure 2. pASCs primed with C4-2B cell-derived conditioned medium develop prostate neoplastic lesions and undergo MET in vivo
(A) Representative nude mice demonstrating tumor formation in the left flanks within 8 to 10 weeks by pASCs (SVF-0455 and SVF-0157) primed with conditioned medium (CM) of C4-2B cells versus no tumor formation in the right flanks by the same pASCs when primed with CM of RWPE-1 cells. Dissected tumors are shown in bottom insets. Scale bar, 50 µm. (B) Photomicrograph of Hematoxylin/Eosin (H&E) stained tumor sections (200x) of C4-2B cells (left panel) and pASCs treated with C4-2B cell-CM (right panel) are shown. Prominent nucleoli (arrowhead) and thin capillaries (arrow) are present. (C) Immunoblot analysis of PC epithelial markers (AR and PSA) in parental pASCs (SVF0455 and SVF0157) and in their tumor-derived sublines. (D-F) Confocal microscopic analysis depicting expression of PC markers of AR and PSA, CK8, and CK5/18 in tumor xenografts derived from C4-2B and C4-2B CM-treated pASCs. AR (red) and PSA, CK8 and CK5/18 (green) are shown as individual channels and as merged channels with AR. Scale bar, 25 µm. (G) Serial transplantation of cells isolated from primary pASC tumors (SVF-0455) developed larger and more aggressive tumors within 4 weeks in secondary recipients. Tumor size is shown in bottom insets. (H) H&E stained tumor sections of PC-3 or C4-2B tumors (left panels) and their respective CM- generated pASC tumors in secondary recipients (right panels) showing poorly differentiated carcinomas with prominent nucleoli. Focal gland formation was evident by occasional clusters of cells with signet-ring morphology (arrows). Scattered inflammatory cells (arrowhead) and thin capillaries were also present. Scale bar, 50 µm. (I, J) Bright field photomicrographs show spindle-shaped morphology of methylene blue stained parental pASCs and their isogenic tumor-derived pASCs (small flat-shaped), respectively. (K) Growth rate kinetics of parental and pASC tumor cells as measured by WST-8 colorimetric assay. (L) Single cell suspension (passage 3) of pASC tumors, generated by C4-2B cell CM were double-stained for CD44-APC and Pan-CK-PE and percent expression of each marker was analyzed by flow cytometry in four separate quadrants (B1-B4). Naïve pASCs and C4-2B cells were used as controls. The percentage of pASC tumor cells expressing CD44 (B1), pan-CK (B4), both markers (B2), and unstained population (B3) is shown (lower panel) relative to control unstained cells (upper panel). (M) Cells isolated from primary pASC tumors (SVF-B123) and tumor xenografts generated by C4-2B CM (middle panel) were expanded in culture (passage 3) and subsequently stained for Pan-CK expression (red) by immunofluorescence analysis. Parental pASCs (bottom panel) and C4-2B (upper panel) were used as negative and positive controls, respectively. Nuclei were stained with DAPI (blue). Scale bars denote 50 µm. Cell Culture data is expressed as fold change ± SEM relative to day 1. * denotes significance at p<0.05.
Figure 3
Figure 3. Expression of neoplastic, vasculogenic, and PC-specific markers in pASC tumor xenografts
(A): Confocal microscopic analysis of AMACR, a PC specific marker, in immunofluorescent stained tumor sections of C4-2B (upper panels) versus pASCs treated with CM of C4-2B cells (middle panels). Intense cytoplasmic immunostaining of AMACR (green) is observed in both xenografts. Lower panels depict control sections in absence of primary antibody (scale bar; 25 µm). (B) A similar pattern of Ki-67 expression (green) was detected in both immunofluorescent stained C4-2B (upper panels) and pASC tumor sections (lower panels). (scale bar; 25 µm). (C, D) Immunohistochemical analysis of neoplastic markers p53 and Ras, respectively, in C4-2B and pASC tumor xenografts. Intense nuclear and cytoplasmic immunostaining for p53 (arrow) and Ras (arrow) is detected in tumor cells in both xenografts. Images shown are under low (scale bar; 50 µm) and high (scale bar; 20 µm) magnification. (E) Immunofluorescence microscopic analysis of vascular cell markers, von Willebrand factor (vWF) and α-smooth muscle actin (α-SMA), in C4-2B (upper panels) and pASC tumor xenografts (lower panels). Confocal images depict vWF (arrow) and α-SMA (arrowhead) stained with green and red fluorescence, respectively, in individual channels and merged images. DAPI stained nuclei are shown in blue. (scale bars, 20 µm).
Figure 4
Figure 4. Functional analysis of PC cell-derived exosomes in oncogenic transformation of pASCs
(A): Morphologic characterization of exosomes isolated from CM of PC (C4-2B and PC-3) and normal prostate epithelial cells (RWPE-1) by Cryo-Scanning Electron Microscope (Cryo-TEM). Scale bar, 100 nm. (B) PCR analysis of tetraspanins (CD9, CD63, CD81, and PDCD61P) and the epithelial marker EpCAM in exosomes procured from RWPE-1 and PC cells. Supernatant of pelleted exosomes was used a control. (C) Cellular uptake of exosomes stained with PKH67, a fluorescent cell membrane dye (green). Confocal microscopy images of unstained (I) or stained exosomes derived from PC and RWPE-1 cells that were added to cultured RWPE-1 cells (II), C4-2B cells (III), or to pASCs (IV) for 2 h. DAPI is shown in red (V) and the merged microphotograph (VI) depicts exosomes uptake by representative pASCs (400x). (D) Quantitative RT-PCR analysis of AR and PSA transcript levels in pASCs cultured in control medium (CTR) or treated with exosomes (Exo) procured from RWPE-1 (green bars) or C4-2B (red bars) cells. Data represent fold change in gene expression expressed as mean ± SEM of five different pASC isolates carried out in duplicates. The $ and # denote significance (P<0.05) in gene expression in pASCs treated with C4-2B derived Exo relative to CTR and RWPE-1 derived exosomes, respectively. (E) Tumor formation (left panel) by the same pASC isolate pretreated with either conditioned medium (CM) (left flank) or Exo (right flank) of C4-2B cells in nude mice. Relative tumor sizes are shown in the right panel and the bottom inset. (F) H&E staining of tumor sections of pASC tumors generated by Exo derived from either C4-2B cells (upper panel) and PC-3 cells (lower panel), showing prominent nucleoli, gland formation (g.f.), signet-ring morphology (arrows), scattered inflammatory cells (arrowhead), and thin capillaries (b.c.). Scale bar, 50 µM. (G) Single cell suspension (passage 3) of pASC tumor cells generated with C4-2B–derived Exo were stained for CD44 (APC) and pan-cytokeratin (pan-CK) (PE) and analyzed by flow cytometry. Näive pASCs and C4-2B cells were used as a control. The percentage of cells expressing CD44 (B1), pan-CK (B4), both (B2), and neither (B3) is shown in stained cells (lower panel) relative to control unstained cells (upper panel).
Figure 5
Figure 5. Selective expression profile of oncomiRNAs, Ras family, and tumor suppressor transcripts in PC cell-derived exosomes and pASC tumor cells
(A, B) Real-time PCR analysis of endogenous levels of miR-125b and miR-130b in normal prostate cells (RWPE-1), PC cells (C4-2B) and their associated exosomes (Exo), parental pASC (SVF-0157) and their derived ASC-tumor cells (Tu-0157). The Tu-0157 cells were isolated from primary tumor xenografts developed in mice by SVF-0157 cells treated with C4-2B–derived Exo. (C, D) Real-time PCR analysis of miR-125b and miR-130b transcripts, respectively, in pASCs (SVF-0157) treated for up to 72 h with Exo derived from RWPE-1 or C4-2B cells. (E, F) Constitutive and induced over-expression of K-Ras and H-Ras, respectively, in RWPE-1, C4-2B and their derived Exo, parental pASCs (SVF-0157), SVF-057 treated with Exo and their derived pASC tumor cells (Tu-0157). (G, H) Relative expression of tumor suppressors Lats2 and PDCD4, respectively, in RWPE-1, C4-2B and their derived Exo, and in parental pASCs (SVF-0157) and their transformed pASCs (Tu-0157). OncomiRNA expression was normalized to U6 snRNA (RNU6B), whereas K-Ras, H-Ras, Lats2, and PDCD4 transcript levels were normalized to GAPDH. Data is expressed as fold change relative to controls. All bars indicate SEM. P-values (<0.05) were calculated by Student’s t test. (I-K) Summary of LC/MS/MS analyses of unique and shared peptide signature between Exo derived from C4-2B and RWPE-1 cells, parental pASCs (SVF-0157) treated with Exo derived from RWPE-1 or C4-2B cells, and their derived pASC tumor cells (Tu-0157).
Figure 6
Figure 6. OncomiRNAs functional analysis in miR mimic-transfected pASCs
(A): Time course study depicting efficiency of expression ofmiR-125b, miR-130b and miR-155 in pASCs using miR mimics strategy. The miR mimics were overexpressed in pASCs and differential gene expression of K-Ras, H-Ras, Lats2 and PDCD4 was measured at 24hr and 72 hr by qRT-PCR analysis. Untransfected (c) and pASCs transfected with non-targeting miR mimics (mock) were used as controls. (B-E): Time course study to determine relative expression of K-ras, H-ras, Lats2 and PDCD4, respectively, in pASCs transfected with oncomiRNA mimics or with non-targeting miR mimics (mock). *denotes significance at P<0.05 relative to mock transfected pASCs by student t-test.
Figure 7
Figure 7. Gene expression analysis of oncogenic factors and tumor suppressors in human microdissected prostate tumors and proposed model for tumor cell derived exosome-ASC interactions in cancer patients
(A): Prostate tumor cells and adjacent normal glands were procured by laser capture microdissection (LCM) from snap-frozen PC tissues (Gleason score <7, 7 and >7; n=18) and analyzed for expression of miR-125b and miR-155 by qRT-PCR. OncomiRNA expression was normalized to U6 snRNA (RNU6B), and data is expressed as fold change relative to normal adjacent glands. *denotes significance at P<0.001 in tumor cells relative to adjacent normal glands by student t-test. (B-D): qRT-PCR analysis of PDCD4, H-Ras and K-Ras gene expression, respectively, in microdissected prostate tumors in comparison adjacent normal glands. Data is presented as mean ± SEM in tumor cells relative to adjacent normal glands. *denotes significance (P<0.05) by student t-test. (E): Proposed model of mutual interactions between tumor tropic pASCs and PC cell-derived exosomes (Exo) in mediating tumor progression in cancer patients. The figure depicts selective recruitment of circulating and/or tissue resident ASCs to tumor microenvironment in cancer patients. The trafficking and functional activation of oncomiRNAs, Ras transcripts and Rab oncoproteins trigger mesenchymal-to-epithelial transition (MET) and neoplastic reprogramming in tumor recruited stem cells by tumor derived exosomes, which in turn promotes clonal expansion and disease progression at primary and/or metastatic sites in cancer patients.

References

    1. Huggins C, Hodges CV. Studies on prostatic cancer. I. The effect of castration, of estrogen and androgen injection on serum phosphatases in metastatic carcinoma of the prostate. CA Cancer J Clin. 1972;22:232–240. - PubMed
    1. Keto CJ, Aronson WJ, Terris MK, et al. Obesity is associated with castration-resistant disease and metastasis in men treated with androgen deprivation therapy after radical prostatectomy: results from the SEARCH database. BJU Int. 2012;110:492–498. - PMC - PubMed
    1. Planat-Benard V, Silvestre JS, Cousin B, et al. Plasticity of human adipose lineage cells toward endothelial cells: physiological and therapeutic perspectives. Circulation. 2004;109:656–663. - PubMed
    1. Ma L, Yang Y, Sikka SC, et al. Adipose tissue-derived stem cell-seeded small intestinal submucosa for tunica albuginea grafting and reconstruction. Proc Natl Acad Sci USA. 2012;109:2090–2095. - PMC - PubMed
    1. Klopp AH, Gupta A, Spaeth E, Andreeff M, Marini F. Concise review: Dissecting a discrepancy in the literature: do mesenchymal stem cells support or suppress tumor growth? Stem Cells. 2011;29:11–19. - PMC - PubMed

Publication types