Case Reports
. 2014 Apr 24;370(17):1615-1625.
doi: 10.1056/NEJMoa1302846. Epub 2014 Apr 9.

Glycosylation, hypogammaglobulinemia, and resistance to viral infections

Affiliations
Case Reports

Glycosylation, hypogammaglobulinemia, and resistance to viral infections

Mohammed A Sadat et al. N Engl J Med. .

Abstract

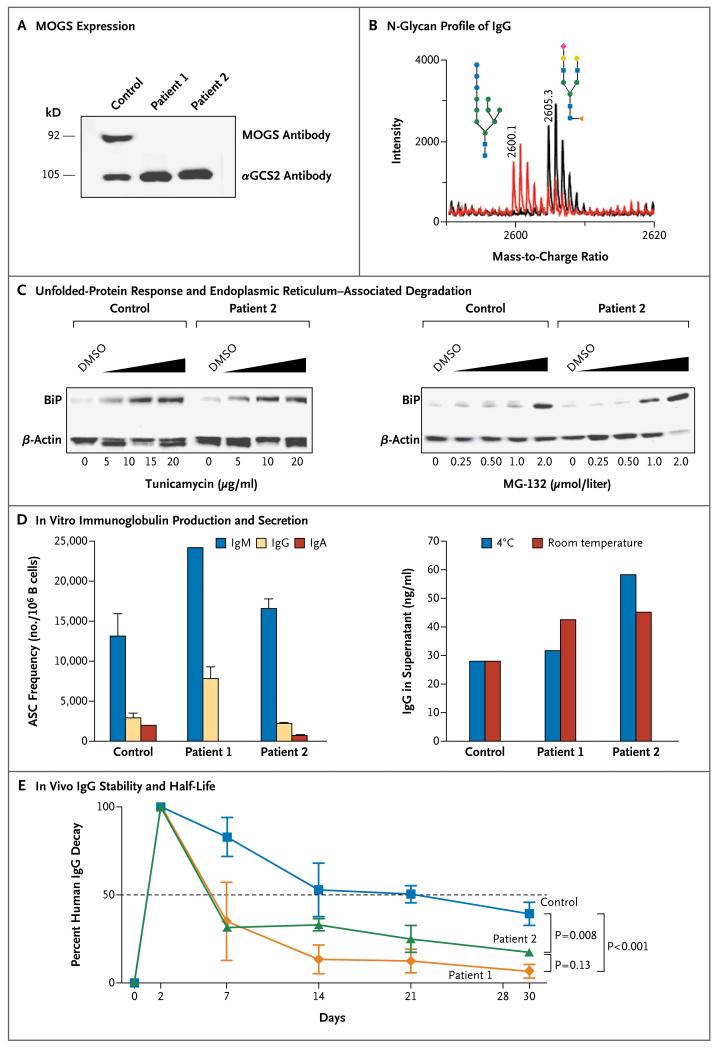
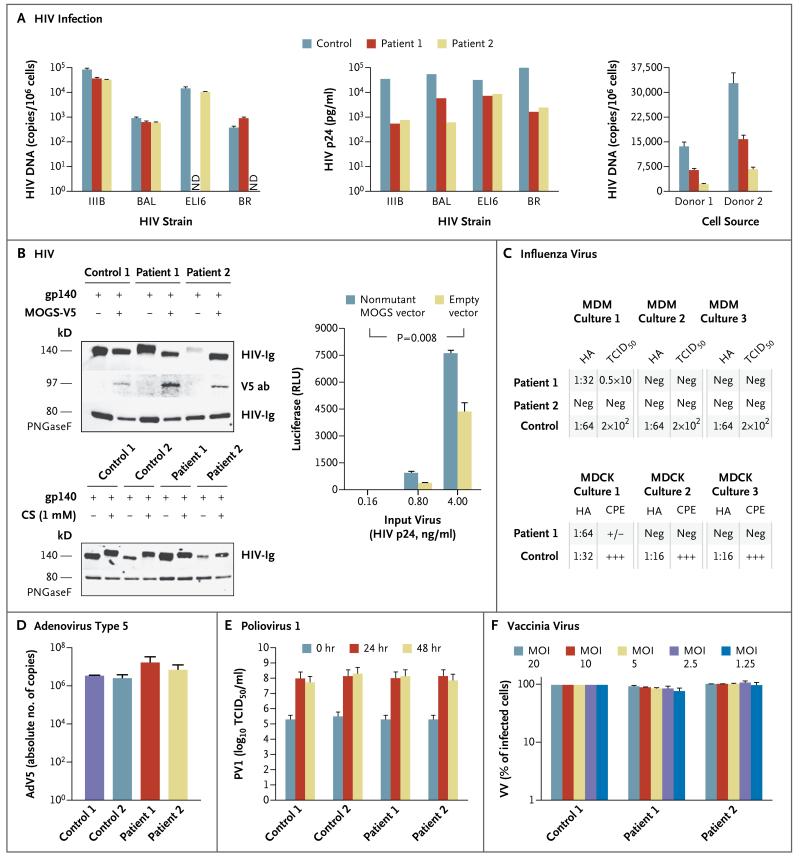
Genetic defects in MOGS, the gene encoding mannosyl-oligosaccharide glucosidase (the first enzyme in the processing pathway of N-linked oligosaccharide), cause the rare congenital disorder of glycosylation type IIb (CDG-IIb), also known as MOGS-CDG. MOGS is expressed in the endoplasmic reticulum and is involved in the trimming of N-glycans. We evaluated two siblings with CDG-IIb who presented with multiple neurologic complications and a paradoxical immunologic phenotype characterized by severe hypogammaglobulinemia but limited clinical evidence of an infectious diathesis. A shortened immunoglobulin half-life was determined to be the mechanism underlying the hypogammaglobulinemia. Impaired viral replication and cellular entry may explain a decreased susceptibility to infections.


Figures

Figure 1
Figure 1. Mannosyl-Oligosaccharide Glucosidase (MOGS) Expression and Immunoglobulin Studies in Two Siblings with Congenital Disorder of Glycosylation Type IIb (CDG-IIb)
The immunoblot in Panel A shows MOGS expression in the patients with CDG-IIb. Protein lysates were obtained from Epstein–Barr virus (EBV)–transformed B-cell lines from patients and controls and hybridized with antibodies against MOGS and alpha-glucosidase 2 (αGCS2); αGCS2 was readily detected on the B-cell lysates from a healthy control and from the patients, but MOGS was not detected on the B-cell lysates from the patients. Panel B shows the N-glycan profile of purified IgG from Patient 2 with CDG-IIb (red) and a healthy control (black), assessed by means of MALDI-TOF (matrix-assisted laser detection desorption ionization–time-of-flight) mass spectrometry. The patient had increased high-mannose glycans (consisting of 3 glucose, 7 mannose, and 2 N-acetylglucosamine molecules, shown at a mass-to-charge ratio of 2600.1) and decreased normal glycans (consisting of 1 N-acetylneuraminic acid, 4 N-acetylglucosamine, 3 mannose, and 1 fucose, shown at a mass-to-charge ratio of 2605.3). The blue squares denote N-acetylglucosamine, green circles mannose, blue circles glucose, yellow circles galactose, red rhombus N-acetylneuraminic acid, and orange triangle fucose. The immunoblots in Panel C show the level of expression of binding immunoglobulin protein (BiP), a molecular chaperone in the endoplasmic reticulum that is up-regulated during endoplasmic reticulum stress, in the EBV-transformed B cells from a healthy control and from Patient 2, which were treated with increasing doses of tunicamycin (an inducer of unfolded-protein response through competitive inhibition of N-acetylglucosamine-1-phosphotransferase) and MG-132 (an inducer of endoplasmic reticulum-associated degradation through proteasome inhibition) for 16 hours. Dimethyl sulfoxide (DMSO) solvent was used in the reconstitution of tunicamycin and MG-132 and was added to cells in adjusted amounts as a negative control for stress. β-actin was used as a loading control. Representative results of multiple experiments are shown. Panel D shows in vitro production and secretion of immunoglobulin, evaluated with the use of antibody-secreting cells (ASCs) differentiated from the B cells of Patient 1, Patient 2, and a healthy control. Peripheral-blood mononuclear cells were stimulated with Staphylococcus aureus Cowan (SAC) particles and CpG-containing oligonucleotides, and ASC frequencies were evaluated by means of an enzyme-linked immunospot assay. Except for IgA ASCs in Patient 1, ASC frequencies in the patients were similar to those in the healthy control (left graph). IgG produced by ASCs was collected and stored at −20°C. Samples were thawed and kept overnight at 4°C or room temperature before evaluation of IgG levels (right graph). T bars represent standard deviations. Representative results of multiple experiments are shown. Panel E shows in vivo IgG stability and half-life in Rag1-knockout mice subcutaneously injected with plasma from the patients or healthy controls. The plasma had been normalized to contain equal amounts of IgG (1 mg or 2.5 mg). Levels of human IgG in the mice were sequentially monitored and analyzed with the use of a two-way analysis of variance with repeated measures and correction for multiple comparisons (Bonferroni’s t-test). I bars represent standard errors. Representative results of multiple experiments are shown.
Figure 2
Figure 2. Viral Susceptibility Studies in the Patients
Panel A shows human immunodeficiency virus (HIV) infection experiments. The left graph shows entry of four HIV strains into activated, CD8-depleted peripheral-blood mononuclear cells (PBMCs) from a healthy control and from the two patients with CDG-IIb. Target cells were incubated with the various strains of HIV for 2 hours at 37°C. After extensive washing, the cells were lysed, and a real-time polymerase-chain-reaction (PCR) assay specific for HIV DNA was performed. T bars represent standard deviations. Data are representative of three independent experiments. ND denotes not done. The middle graph shows the level of HIV replication under the same conditions as those used to assess viral entry. Infected cells were maintained at 37°C, culture supernatants were harvested, and the HIV p24 protein level was determined by means of enzyme-linked immunosorbent assay (ELISA). Data shown represent the level of viral replication at day 3 or day 4 after infection. Data are representative of four independent experiments. The right graph shows viral entry of the ELI6 strain, recovered at day 4 from each cell culture performed for the assessment of HIV p24. Target cells from two healthy donors were prepared by activating their PBMCs for 2 days, followed by purification of their CD4+ T cells. The amount of virus from each of the three sources that was incu bated with target cells was normalized according to the level of p24 measured by ELISA in the culture supernatant. A realtime PCR assay specific for HIV DNA was performed. T bars represent standard deviations. In Panel B, the top immunoblot shows primary fibroblast lysates from the patients and controls, which were transfected with an HIV glycoprotein 140 (gp140)-coding vector with or without a V5-tagged nonmutant mannosyl-oligosaccharide glucosidase (MOGS)–expression vector. As expected on the basis of their N-glycan trimming defect, the viral gp140 synthesized in the cells from the patients had a higher molecular weight than that synthesized in the control cells. When the cells from the patients were transfected with the nonmutant MOGS-V5 vector, the gp140 molecular weight reverted to the control molecular weight. The differences in molecular weight depended on the N-glycosylation pattern, as revealed after N-glycan removal by means of peptide-N-glycosidase F (PNGaseF) digestion. The bottom immunoblot shows the same distinctive HIV gp140 glycosylation pattern detected in cells from the controls and those from the patients, but in this case, the gp140 glycosylation pattern detected in the control cells was induced into the patients’ pattern by the MOGS inhibitor castanospermine (CS). HIV-Ig denotes rabbit polyclonal antihuman HIV antibody, and V5 ab mouse monoclonal anti-V5 antibody. The graph shows the infectivity of HIV produced in fibroblasts from Patient 2, which was greater after cotransfection of fibroblasts with nonmutant MOGS than with empty expression vector. RLU denotes relative light units. T bars represent standard deviations. The P value is based on a two-way analysis of variance with repeated measures. Data are representative of three independent experiments. In Panel C, the upper chart shows viral titers after infection of cells from Patient 1, Patient 2, and a healthy control with the virus that caused the 2009 influenza A (H1N1) pandemic. Viral titers were assessed on the basis of hemagglutination (HA) and the 50% tissue-culture infective dose (TCID50) of the virus produced by monocyte-derived macrophages (MDM) from the patients and the healthy control (three cultures per person). No virus was isolated from any of the MDM cultures from Patient 2. Only one of the cultures from Patient 1 replicated the virus, but the titer was 1.5 log lower than that in the control cells. The lower chart shows HA titers and evidence of a cytopathic effect (CPE) in Madin–Darby canine kidney (MDCK) cells that were infected with equivalent amounts of influenza virus produced by MDM cultures from Patient 1 and a control. Only one of three cultures incubated with virus from Patient 1 had a positive HA titer and minimal CPE (+/−). CPE and HA titers were negative (Neg) in the other two cultures. All three MDCK cultures that were infected with virus that was produced by the control cells showed marked CPE (+++) and positive HA titers. Panel D shows the results of a secondary-infection experiment in which adenovirus type 5 (AdV5) produced from fibroblasts obtained from patients and controls during primaryinfection experiments was normalized to infect control fibroblasts. Cells were lysed, and virus was measured in triplicate by means of a quantitative PCR assay. T bars represent standard deviations. Panel E shows the results of a secondary-infection experiment in which poliovirus 1 (PV1, Mahoney strain) produced from fibroblasts obtained from patients and controls during primary-infection experiments was normalized to infect HeLa cells. The CPE was assessed 72 hours after inoculation, and titers were calculated with the use of the Reed and Muench method. T bars represent standard errors. Panel F shows the results of a secondary-infection experiment in which vaccinia virus (VV) produced from EBV-transformed B-cell lines obtained from the patients and a control during primary-infection experiments was normalized to infect control EBV-transformed B-cell lines. Cells were lysed, and serial dilutions of the cell lysates were tested for their ability to infect B cells from a healthy donor. MOI denotes multiplicity of infection. T bars represent standard deviations.

Comment in

References

    1. Varki A. Essentials of glycobiology. 2nd ed. Cold Spring Harbor Laboratory Press; Cold Spring Harbor, NY: 2009. - PubMed
    1. De Praeter CM, Gerwig GJ, Bause E, et al. A novel disorder caused by defective biosynthesis of N-linked oligosaccharides due to glucosidase I deficiency. Am J Hum Genet. 2000;66:1744–56. - PMC - PubMed
    1. Faid V, Chirat F, Seta N, Foulquier F, Morelle W. A rapid mass spectrometric strategy for the characterization of N- and O-glycan chains in the diagnosis of defects in glycan biosynthesis. Proteomics. 2007;7:1800–13. - PubMed
    1. Buckner CM, Moir S, Ho J, et al. Characterization of plasmablasts in the blood of HIV-infected viremic individuals: evidence for nonspecific immune activation. J Virol. 2013;87:5800–11. - PMC - PubMed
    1. Moir S, Lapointe R, Malaspina A, et al. CD40-mediated induction of CD4 and CXCR4 on B lymphocytes correlates with restricted susceptibility to human immunodeficiency virus type 1 infection: potential role of B lymphocytes as a viral reservoir. J Virol. 1999;73:7972–80. - PMC - PubMed

Publication types

Supplementary concepts