. 2014 May;24(5):839-49.
doi: 10.1101/gr.165415.113. Epub 2014 Apr 9.

Predicting the virulence of MRSA from its genome sequence

Affiliations

Predicting the virulence of MRSA from its genome sequence

Maisem Laabei et al. Genome Res. 2014 May.

Abstract

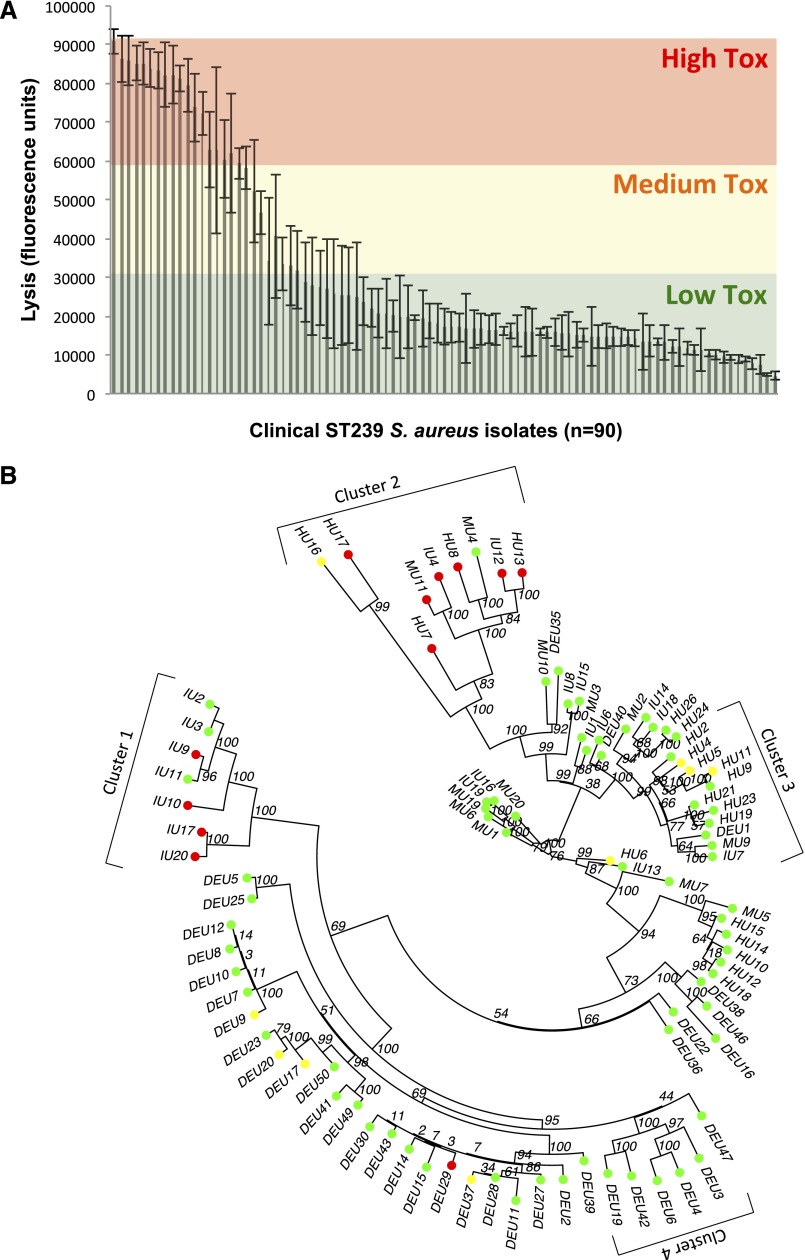
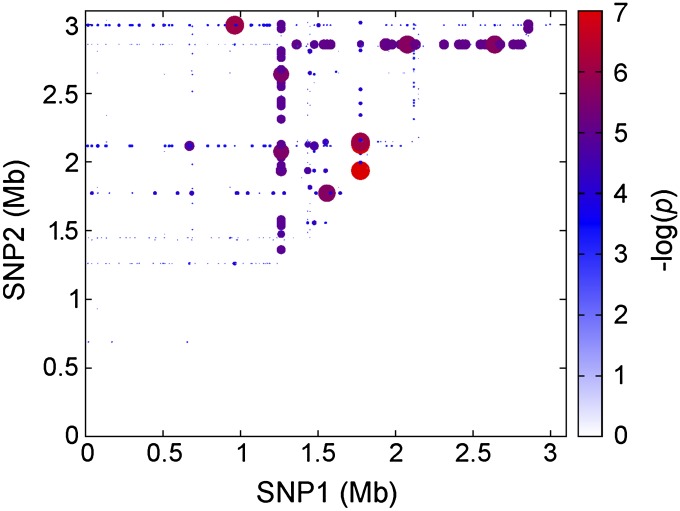
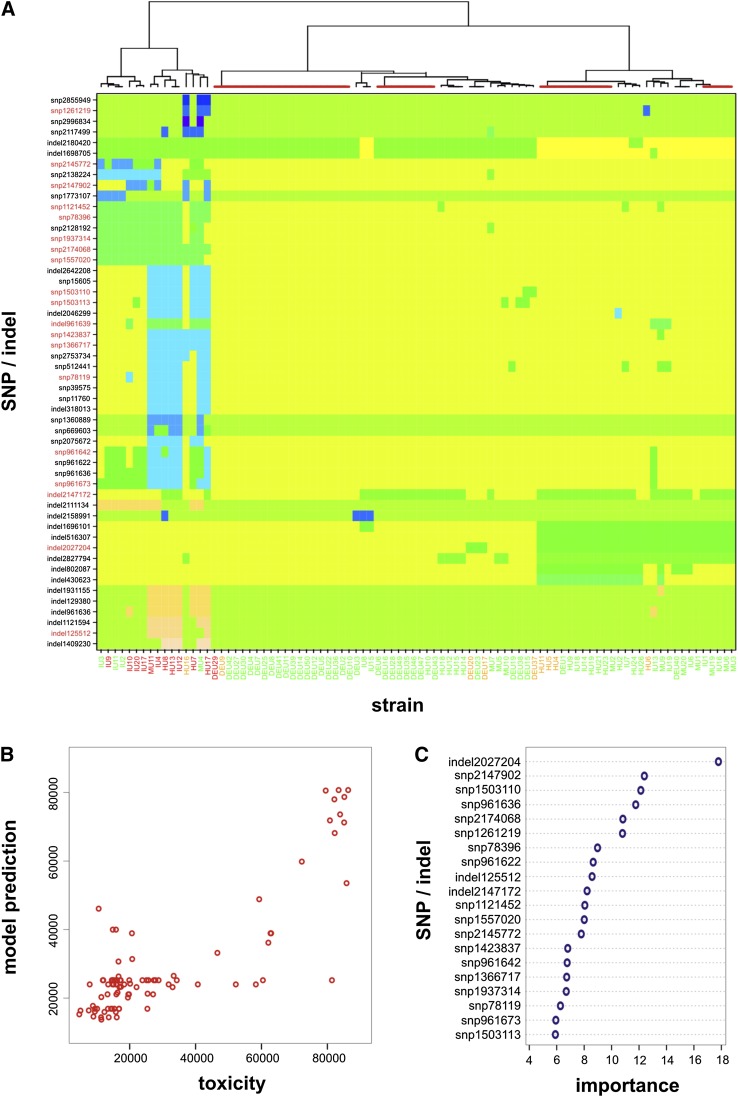
Microbial virulence is a complex and often multifactorial phenotype, intricately linked to a pathogen's evolutionary trajectory. Toxicity, the ability to destroy host cell membranes, and adhesion, the ability to adhere to human tissues, are the major virulence factors of many bacterial pathogens, including Staphylococcus aureus. Here, we assayed the toxicity and adhesiveness of 90 MRSA (methicillin resistant S. aureus) isolates and found that while there was remarkably little variation in adhesion, toxicity varied by over an order of magnitude between isolates, suggesting different evolutionary selection pressures acting on these two traits. We performed a genome-wide association study (GWAS) and identified a large number of loci, as well as a putative network of epistatically interacting loci, that significantly associated with toxicity. Despite this apparent complexity in toxicity regulation, a predictive model based on a set of significant single nucleotide polymorphisms (SNPs) and insertion and deletions events (indels) showed a high degree of accuracy in predicting an isolate's toxicity solely from the genetic signature at these sites. Our results thus highlight the potential of using sequence data to determine clinically relevant parameters and have further implications for understanding the microbial virulence of this opportunistic pathogen.


Figures

Figure 1.
Figure 1.
Toxic activity of clinical ST239 isolates. (A) The toxic activity of 90 ST239 isolates was assayed by incubating their supernatants with lipid vesicles containing a fluorescent dye. Dye release due to toxin-mediated vesicle lysis is determined using a fluorometer. (B) A maximum likelihood tree based on whole-genome sequences of the 90 isolates illustrating the distribution of the toxic activities of each isolate. Toxicity has been color-coded (red for highly lytic, yellow/amber for moderately lytic, and green for low level lysis). Clusters 1–4 are indicated for use in the stringent GWAS analysis.
Figure 2.
Figure 2.
Predicted toxicity correlates with disease severity in vivo. Using high and low doses (7.8–8.0 and 3.7–4.1 × 10⁷ CFU, respectively), mice were inoculated intravenously with the high and low toxic isolates (HU13 and MU9, respectively), and survival of the mice, the development of septic arthritis, and weight loss were recorded as indications of disease severity. In each case the highly toxic HU13 isolate caused the most severe disease symptoms. (A) n = 10–15. (B) n = 8–10. (C) n = 10–20. (D) n = 10. (E) n = 10–19. (F) n = 10. Significant P-values (<0.05) are indicated (*).
Figure 3.
Figure 3.
Functional verification using transposon mutagenesis. Mutated S. aureus isolates with transposon insertions in 15 of the 124 toxicity-associated loci were isolated (all in intergenic loci). Four of the 15 transposon insertions affected the toxicity of the isolate. The bars represent the mean % T-cell survival following incubation with bacterial supernatant, and the error bars the 95% confident intervals. Wild type represents the unmutated parent isolate, AgrB is a negative control, and the following are the transposon insertion mutants and their associated polymorphism: 95E07: 301089; 93B09: 761112; 82B04: 787629; 180A03: 799276; 207A03: 1121452; 90D01: 1503110; 137C12: 1931155; 45D06: 2027204; 179E03: 211134; 108B09: 2532617; 113D01: 2571739; 86C03: 2640325; 168E05: 2657438; 72A04: 2753734; 64A09: 2810368.
Figure 4.
Figure 4.
SNP2174068 has a major impact on the response of AgrC to AIP and hence toxicity. Dose-response curves for the activation of the lux-based agrP3 reporter via AIP-1 by the TW20 agrC allele (•) compared with the SNP2174068 variant (■).
Figure 5.
Figure 5.
Heat-map representing interacting SNPs conveying epistasis between SNPs that affects an isolate’s toxicity. Each SNP is represented on both the x- and y-axes with the origin of replication based at the intersection of the axes (at zero). The size and color of the spot represent the significance of the interaction between SNPs as illustrated by the colored bar.
Figure 6.
Figure 6.
Genetic signatures affecting the toxicity of MRSA isolates. (A) Unsupervised hierarchical clustering analysis of significant SNPs/indels affecting toxicity in 90 isolates of the MRSA lineage ST239, color-coded (along the bottom) according to toxicity classes: low (green, <35,000), medium (orange, <65,000), and high (red, >65,000). Where an isolate has either the reference sequence at a site or the SNP/indel is illustrated as a change in block color across the rows. The most highly toxic strains are found to cluster together, indicating similar signatures independent of genetic background. Clusters highlighted by red bars on top denote strains with identical SNP/indel signatures. SNPs and indels highlighted in red (on the left-hand side) are those found to have high importance for the predictive model. (B) Random forest regression analysis shows a good fit between the strains’ observed level of toxicity and those predicted by the model; most outliers belong to clusters of identical strains, which cannot be resolved by these SNP/indel signatures. (C) Top 20 SNP and indels with highest influence on class prediction error, ordered by descending degree of importance.

References

    1. Anderson KL, Roberts C, Disz T, Vonstein V, Hwang K, Overbeek R, Olson PD, Projan SJ, Dunman PM 2006. Characterization of the Staphylococcus aureus heat shock, cold shock, stringent, and SOS responses and their effects on log-phase mRNA turnover. J Bacteriol 188: 6739–6756 - PMC - PubMed
    1. Bae T, Baba T, Hiramatsu K, Schneewind O 2006. Prophages of Staphylococcus aureus Newman and their contribution to virulence. Mol Microbiol 62: 1035–1047 - PubMed
    1. Beltrao P, Ryan C, Krogan NJ 2012. Comparative interaction networks: bridging genotype to phenotype. Adv Exp Med Biol 751: 139–156 - PMC - PubMed
    1. Bierne H, Hamon M, Cossart P 2012. Epigenetics and bacterial infections. Cold Spring Harb Perspect Med 2: a010272. - PMC - PubMed
    1. Borrell S, Gagneux S 2011. Strain diversity, epistasis and the evolution of drug resistance in Mycobacterium tuberculosis. Clin Microbiol Infect 17: 815–820 - PMC - PubMed

Publication types

MeSH terms