. 2014 Jul 1;112(1):95-109.
doi: 10.1152/jn.00856.2013. Epub 2014 Apr 9.

Variation in motor output and motor performance in a centrally generated motor pattern

Affiliations

Variation in motor output and motor performance in a centrally generated motor pattern

Angela Wenning et al. J Neurophysiol. .

Abstract

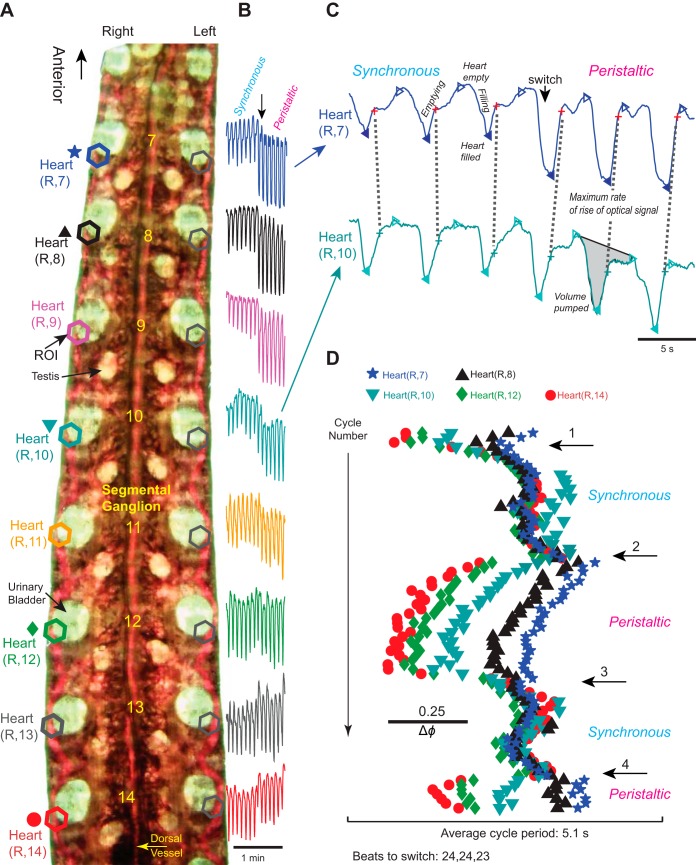
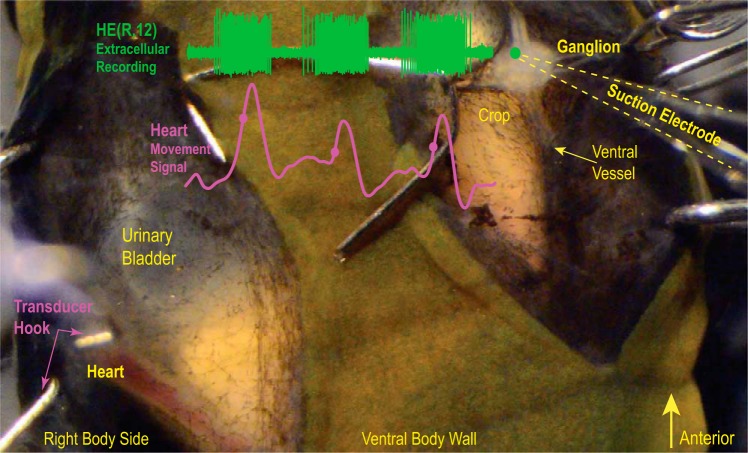
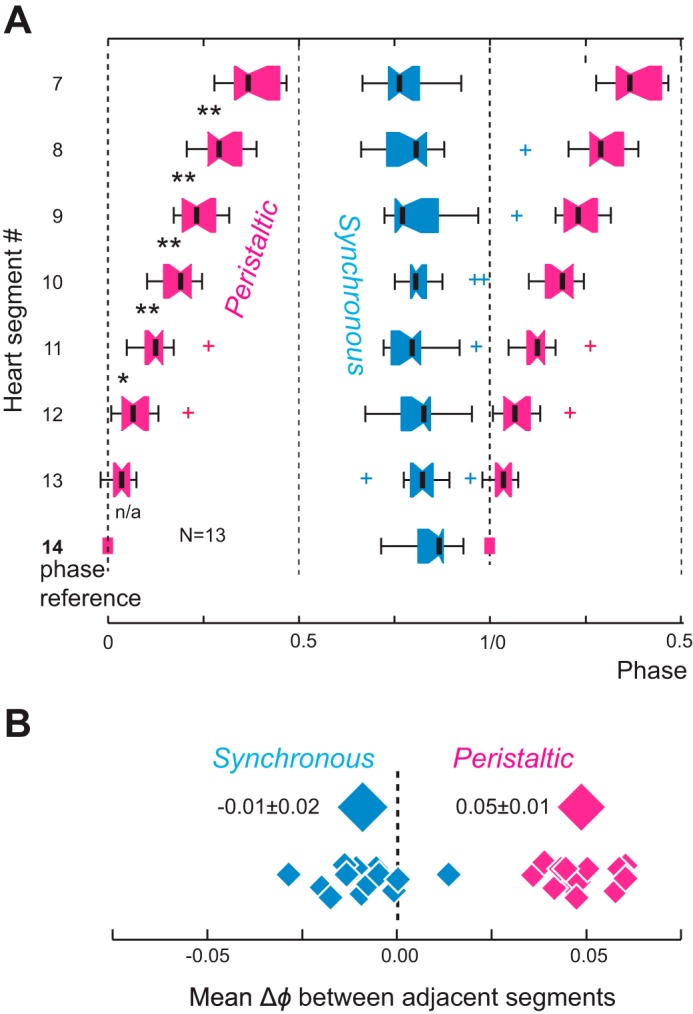
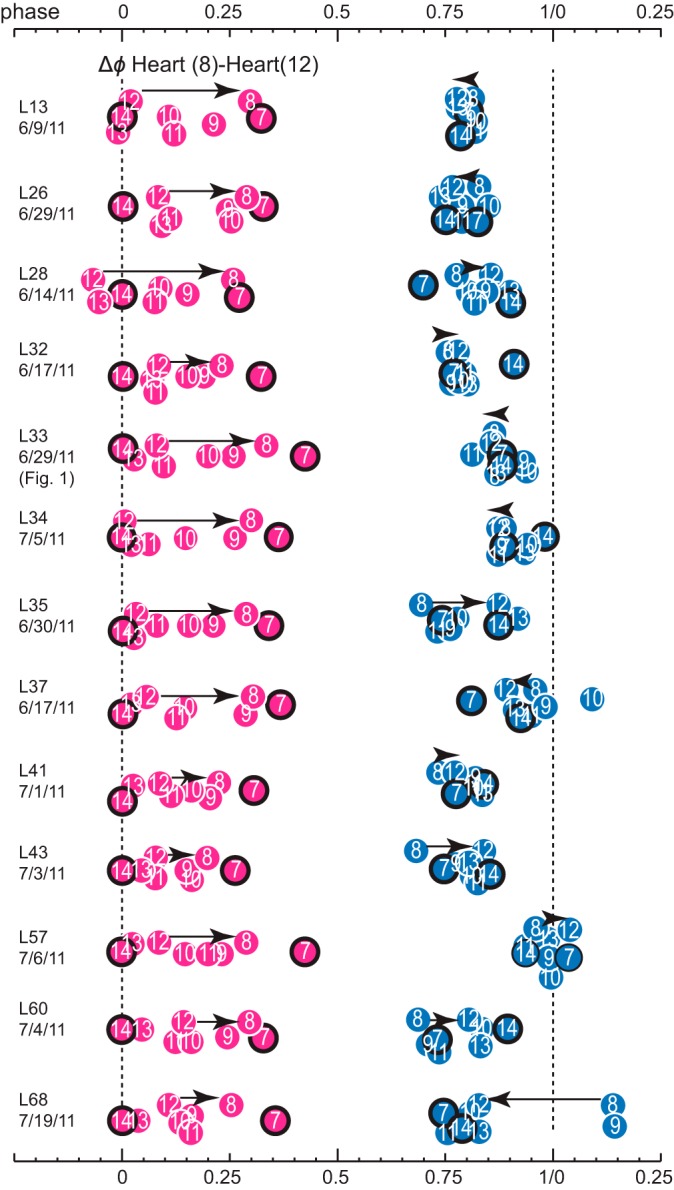
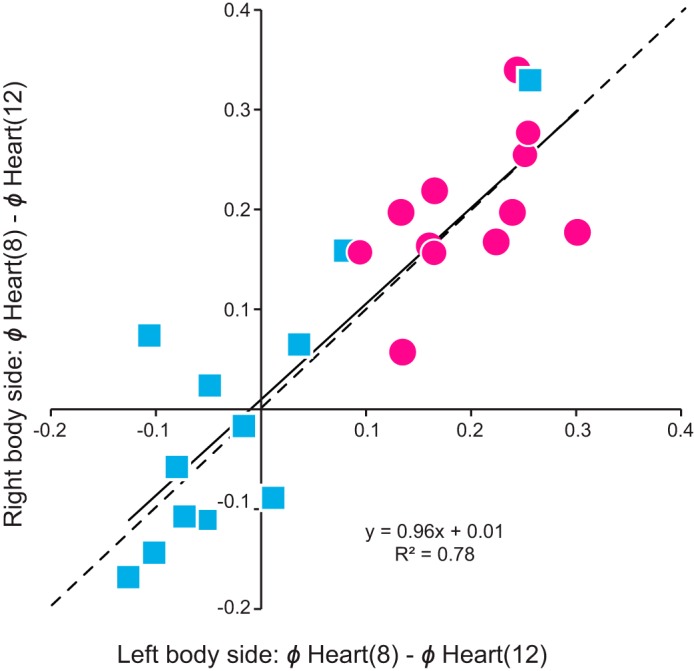
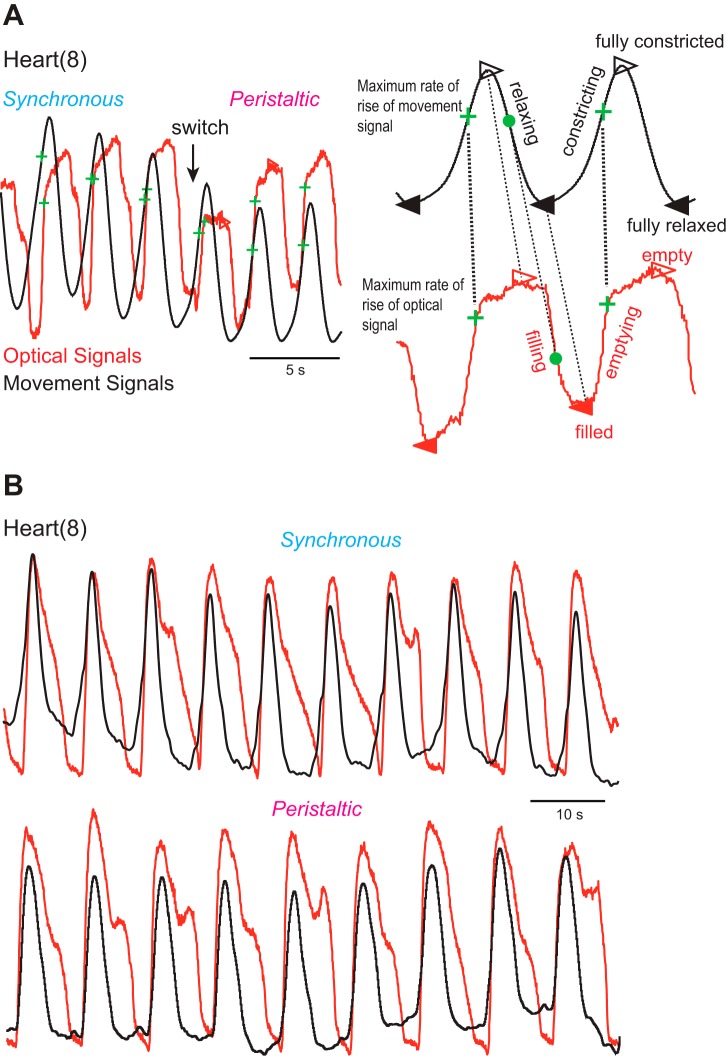
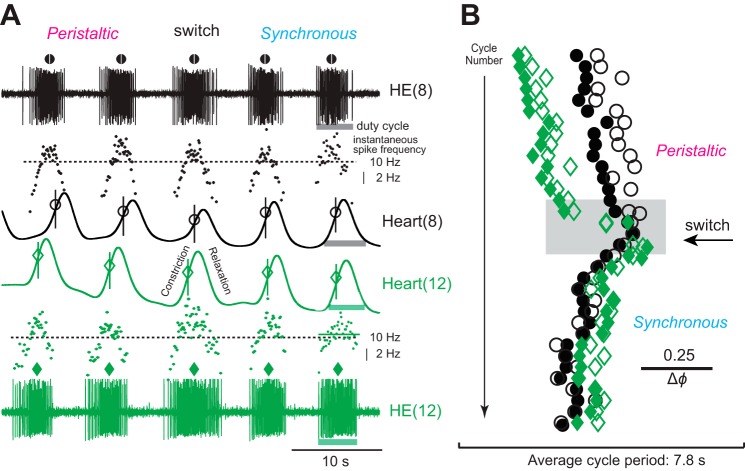
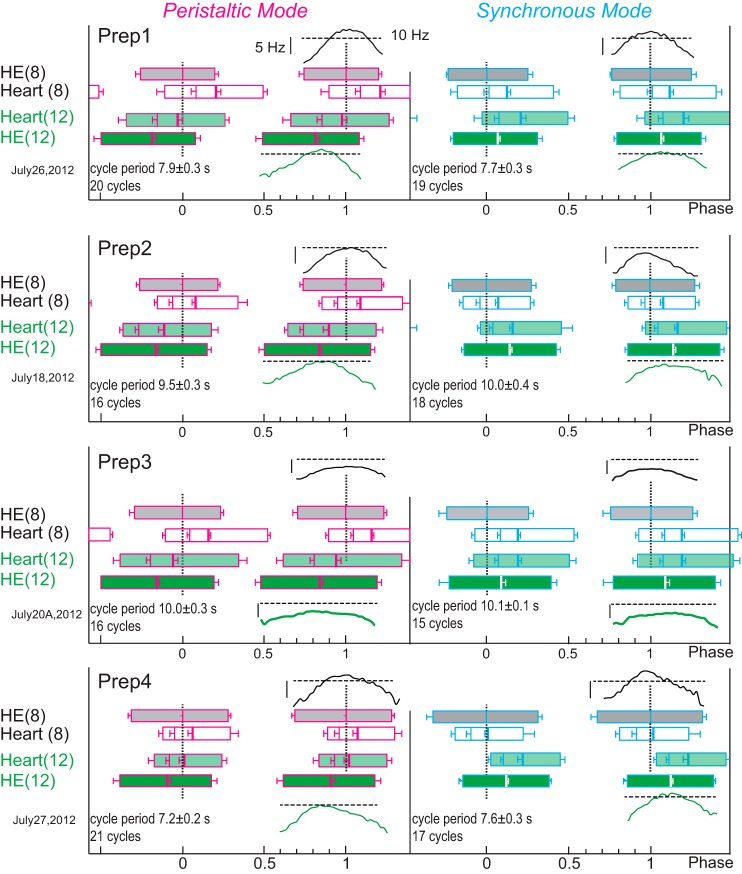
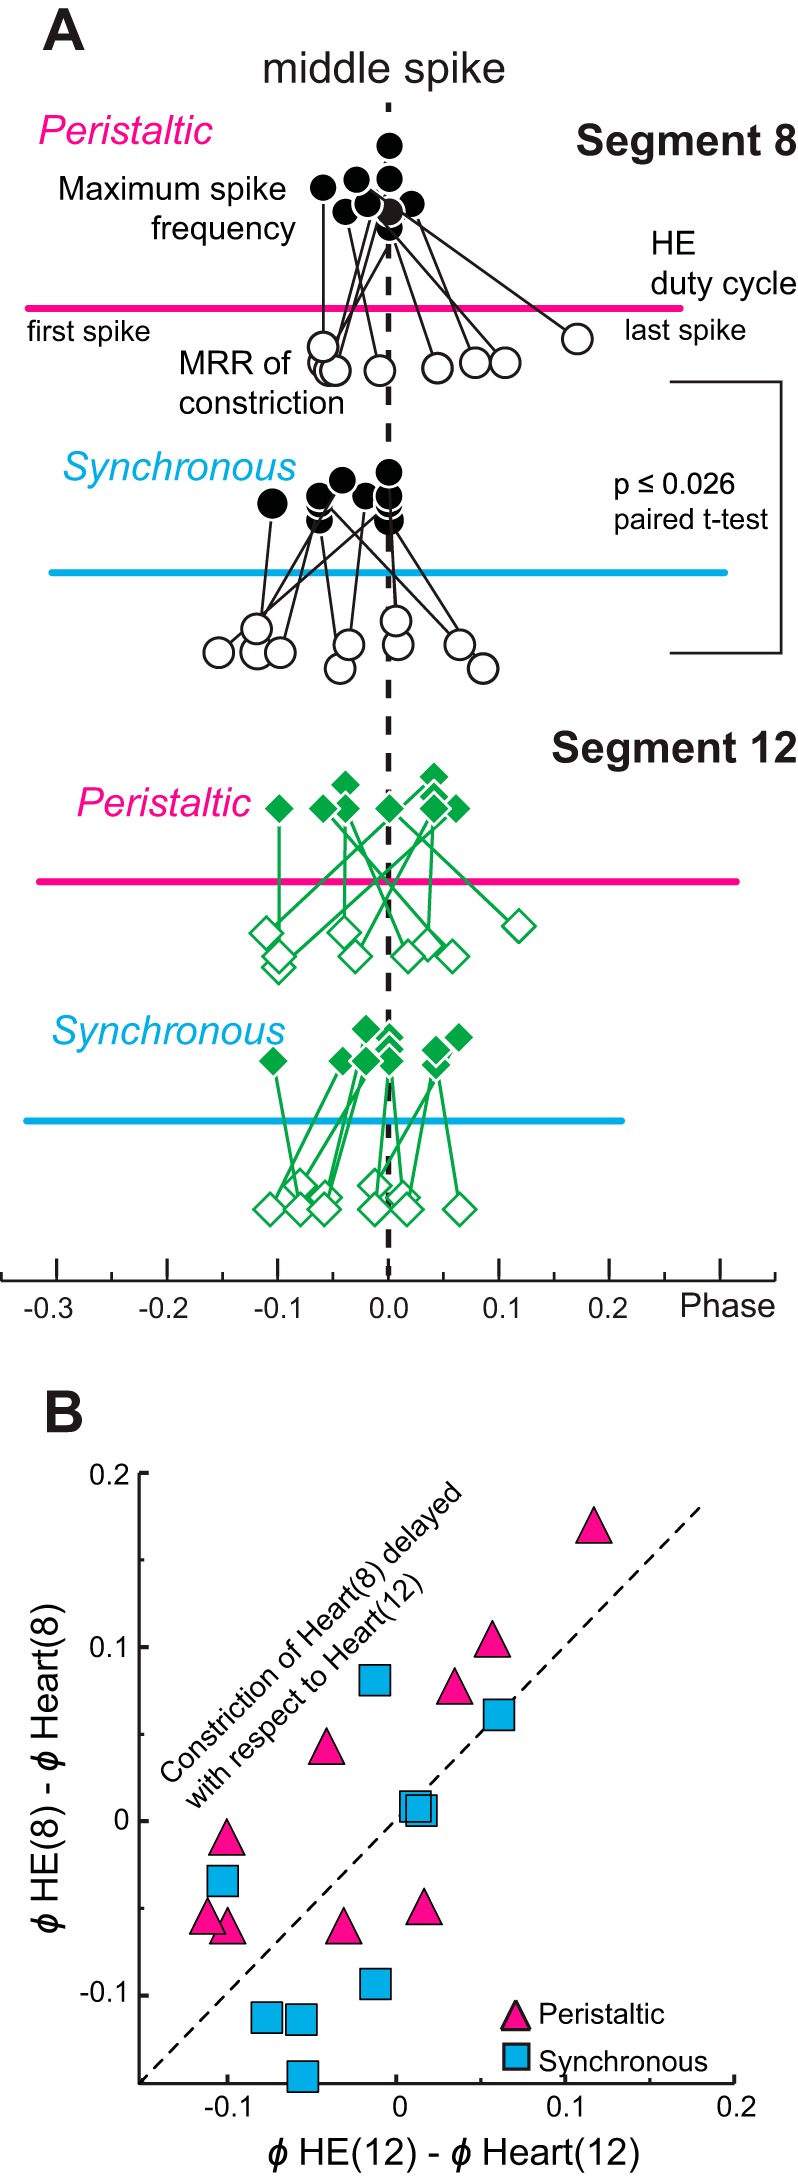
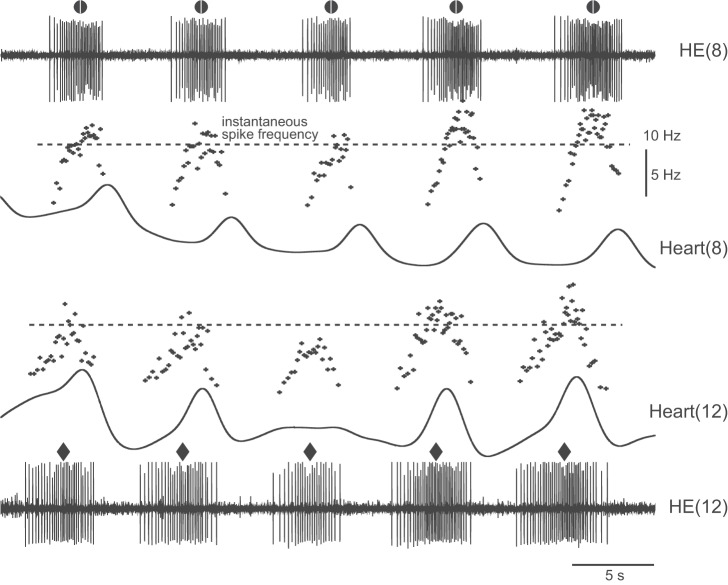
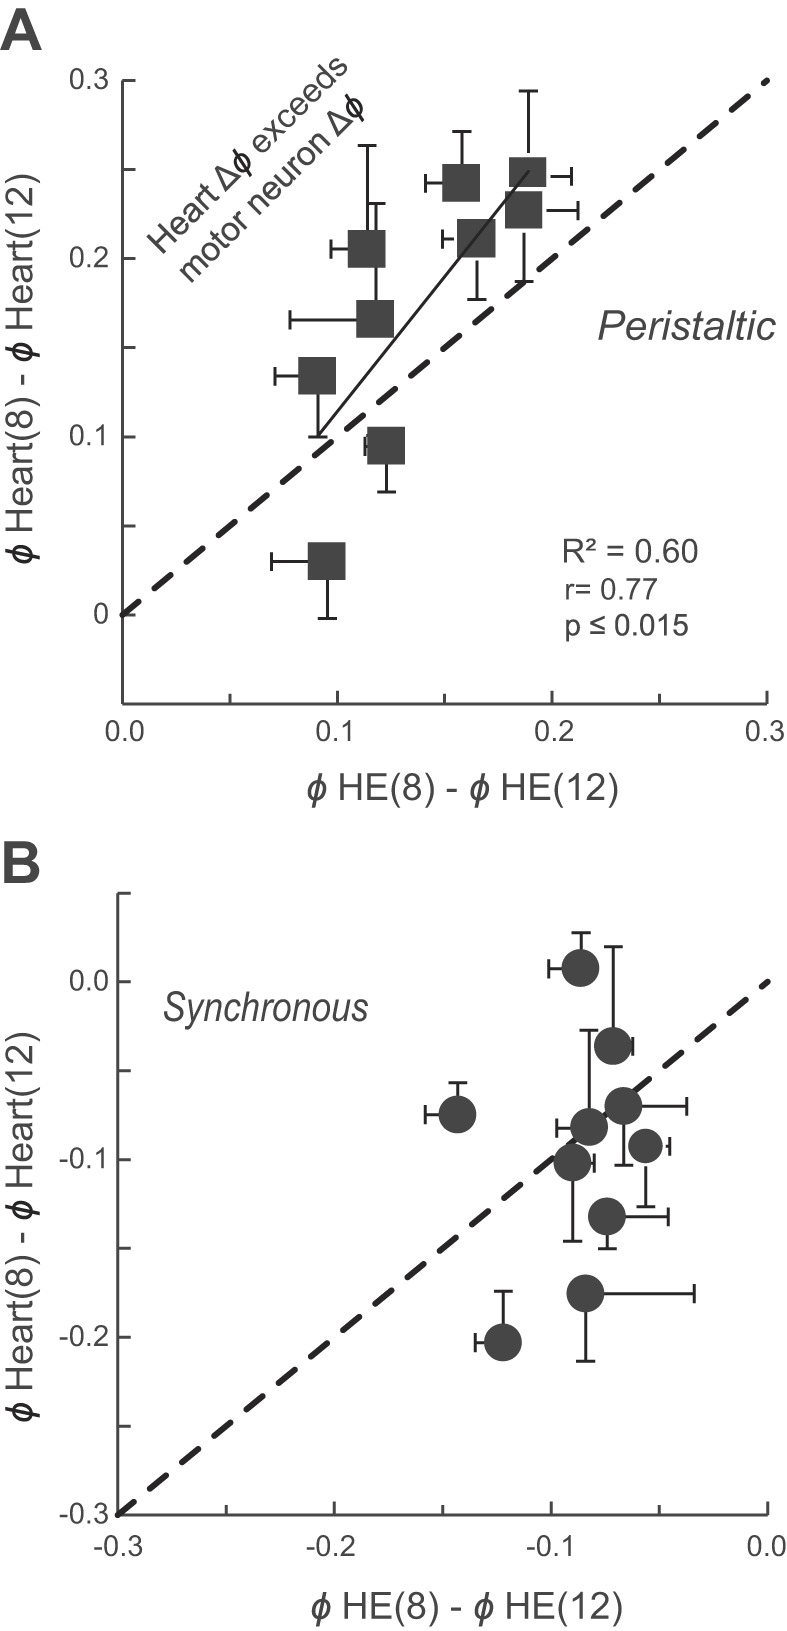
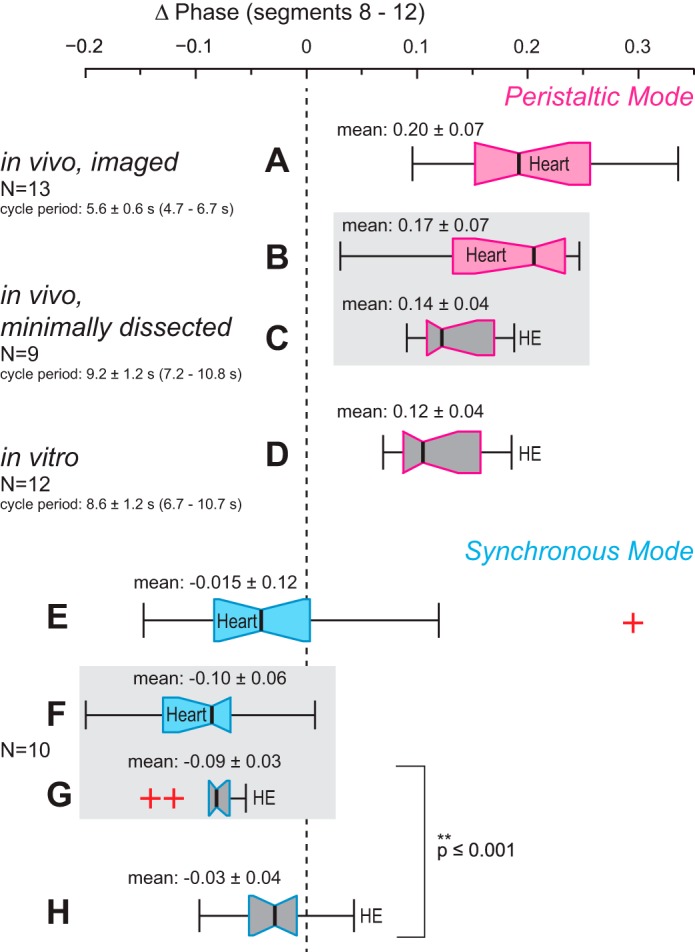
Central pattern generators (CPGs) produce motor patterns that ultimately drive motor outputs. We studied how functional motor performance is achieved, specifically, whether the variation seen in motor patterns is reflected in motor performance and whether fictive motor patterns differ from those in vivo. We used the leech heartbeat system in which a bilaterally symmetrical CPG coordinates segmental heart motor neurons and two segmented heart tubes into two mutually exclusive coordination modes: rear-to-front peristaltic on one side and nearly synchronous on the other, with regular side-to-side switches. We assessed individual variability of the motor pattern and the beat pattern in vivo. To quantify the beat pattern we imaged intact adults. To quantify the phase relations between motor neurons and heart constrictions we recorded extracellularly from two heart motor neurons and movement from the corresponding heart segments in minimally dissected leeches. Variation in the motor pattern was reflected in motor performance only in the peristaltic mode, where larger intersegmental phase differences in the motor neurons resulted in larger phase differences between heart constrictions. Fictive motor patterns differed from those in vivo only in the synchronous mode, where intersegmental phase differences in vivo had a larger front-to-rear bias and were more constrained. Additionally, load-influenced constriction timing might explain the amplification of the phase differences between heart segments in the peristaltic mode and the higher variability in motor output due to body shape assumed in this soft-bodied animal. The motor pattern determines the beat pattern, peristaltic or synchronous, but heart mechanics influence the phase relations achieved.

Keywords: intersegmental coordination; leech; motor pattern in vivo; motor performance; variability.


Figures

Fig. 1.
Fig. 1.
Imaging the hearts to analyze the beat pattern of adult leeches. A: midbody portion of a flattened leech, ventral side up and transilluminated (i.e., from below). Regions of interest (ROIs; hexagons) were placed over similar sections of the hearts in segments 7–14 on both sides, yielding 8 pairs of digitized optical signals. Segment numbers are placed along the chain of ganglia. Colors and symbols are shown next to the appropriate heart segment and are also used in B–D. Segments 6 and anterior and segments 15 and posterior are blocked from view. B: digitized optical signals for 14 beat cycles of 8 heart segments on the right body side [heart(R, 7) to heart(R, 14)] across a switch from the synchronous to the peristaltic mode. Note that optical signals in the hearts of segments 10 and anterior increase in size upon the switch from the synchronous to the peristaltic mode; excerpt from a longer record. C: digitized optical signals for 6 beat cycles of heart(R, 7) (top, blue) and heart(R, 10) (bottom, turquoise) across a switch from the synchronous to the peristaltic mode. Excerpt from the record shown in B. The maximum rate of rise (MRR) of the optical signal corresponds to the maximum rate of emptying of the heart segment and is indicated by a cross [red, heart(R, 7); aqua, heart(R, 12)]. Filled triangles indicate maximum fullness, and open triangles indicate maximum emptying of the hearts. Note that heart(R, 7) constricts just before heart(R, 10) during the synchronous mode but considerably later during the peristaltic mode. The volume pumped in a given heartbeat cycle corresponds to the area under the curve between 2 maxima of the optical signal (see shaded area in heart segment 10). D, top to bottom: the actogram shows the temporal relations of the MRR of emptying for the hearts on the right body side in segments 14, 12, 10, 8, and 7 across 4 switches (numbered arrows). The scale bar assists in determining the intersegmental phase differences [average cycle period of the reference segment, heart(R, 14) = 5.1 s = 1 phase unit]. Note that despite beat-to-beat variability of the phase between heart segment emptyings the coordination modes are clearly recognizable. Data from heart segments 13, 11, and 9 were omitted for clarity. Image, signals, and actogram are from the same animal.
Fig. 2.
Fig. 2.
Minimally dissected leech. Ventral view of segment 12. Small hooks on both sides held the preparation in place. The exposed ganglion is seen on the right, with the green dot showing the approximate position of the HE heart motor neuron in the ganglion. The bursting activity of the heart (HE) motor neuron was recorded extracellularly (green trace), and heart movements were recorded with a movement transducer (pink trace). Filled circles indicate the MRR of the movement signal. The hook of the movement transducer cradles the heart. Note that the heart is filled with blood.
Fig. 3.
Fig. 3.
Phase relations for the MRR of emptyings between the hearts of midbody segments 7 to 14 in intact adult leeches (video imaging). A: box-and-whisker plot (see methods for details). The phase marker is heart(14) in the peristaltic mode (0 phase). Pink, peristaltic mode; blue, synchronous mode. Note that the slopes of phase progressions differ in the 2 coordination modes. There is a distinct, almost linear rear-to-front phase progression of emptyings in the peristaltic mode and, on average, no phase progression of emptying in the synchronous mode. Note that variability across animals is higher in the synchronous mode than in the peristaltic mode. n = 13 animals; 3–4 switch cycles per animal. Asterisks denote significance levels between adjacent segments (*P ≤ 0.05, **P ≤ 0.01); n/a, not applicable. B: mean phase differences (Δϕ) between adjacent segments for all 13 experiments in the synchronous and the peristaltic coordination mode. The diamonds above each distribution represent the average phase difference (±SD) between adjacent segments across all preparations. Note that across animals, the average phase differences of emptyings between adjacent segments do not overlap in the 2 coordination modes.
Fig. 4.
Fig. 4.
Variability of intersegmental phases of the MRR of emptyings in 13 different animals in both coordination modes (pink, peristaltic; light blue, synchronous). Animals were numbered in the order they were imaged from a batch of 68 leeches (L13, L26…, followed by the experimental date; see methods for details). Numbers in circles refer to the heart segment; anterior and posterior-most segments (7 and 14) are outlined in black. Phase reference (0 phase) is segment 14 in the peristaltic heart tube. Each circle represents the mean phase of the MRR of emptyings of all beats in a single switch cycle per animal. Black arrows connect heart segments 8 and 12 and illustrate the direction of the progression of emptyings. Note the clear rear-to-front progression in the peristaltic mode and the very variable phase differences and direction of progression of emptyings in the synchronous mode. For example, in preparation L68 (leech 68) emptyings in heart(8) and heart(9) occur later than in all other segments (L68 is the outlier on Fig. 3 for heart segments 8 and 9, synchronous mode). L33 is the preparation shown in Fig. 1.
Fig. 5.
Fig. 5.
The beat pattern of the hearts in imaged adult leeches is bilaterally symmetrical. The mean phase differences of the MRR of emptyings between heart segments 12 and 8 on the right body side are plotted over those on the left body side for the peristaltic (pink circles) and synchronous (blue squares) coordination modes. Note that there is no preference for body side: data fall on both sides near the (dashed) identity line (i.e., perfect symmetry), and the slope of the (solid) fitted line is almost 1.
Fig. 6.
Fig. 6.
Alignment of optical signals (red traces) and movement signals (black traces) in minimally dissected animals. Optical and movement signals were vertically matched in size to facilitate comparison. A: recordings are across a switch from the synchronous to the peristaltic mode in heart(8). The 2 expanded beat cycles on right show the 4 time points that the analysis code identified for the movement and the optical signals, respectively: filled triangles correspond to the trough (i.e., a relaxed and filled heart), open triangles to the peak (i.e., a constricted and empty heart), green crosses to the MRR (i.e., constricting and emptying), and filled circles to the maximum rate of decay (i.e., relaxing and filling). Note that constricting (upstroke of the movement signal) and emptying (upstroke of the optical signal) align well and that the MRR of the movement signal corresponds to the MRR of the optical signal. B: same experimental design, different animal, heart(8). Note that optical and movement traces align perfectly during constricting and emptying in both coordination modes but that filling is delayed and the heart remains empty for some time while relaxing.
Fig. 7.
Fig. 7.
Extracellular recordings from 2 ipsilateral heart motor neurons and movement recordings of the corresponding heart segments in vivo (minimally dissected leeches). A: 5 bursts of the heart motor neurons in segments 8 [HE(8), black] and 12 [HE(12), green] across a switch from the peristaltic to the synchronous mode. Symbols above each motor neuron burst denote its middle spike [HE(8), circle; HE(12), diamond]. Instantaneous spike frequency is shown for each burst [HE(8), black dots; HE(12), green dots]. Dotted horizontal lines correspond to 10 Hz. Movement signals in heart(8) (black) are shown below the appropriate motor neuron burst and those of heart(12) (green) above. The MRR of movement is indicated for each beat [heart(8), circle; heart(12), diamond; vertical lines added for visual clarity]. Light-colored bars indicate the duty cycles for the motor neurons and for the heart segments (segment 8, gray; segment 12, green). In the peristaltic mode, the HE(12) heart motor neuron fires before the HE(8) heart motor neuron and heart(12) constricts before heart(8), while both motor neurons and both hearts are active almost simultaneously in the synchronous mode. Note that the MRR of movement coincides with the peak spike frequency of the corresponding heart motor neuron. Note also that hearts may begin to relax even while the motor neuron is still firing (e.g., in segment 12). B: actogram shows the phase relations of the middle spike of the motor neurons and the MRR of movement over many beat cycles across a switch from the peristaltic to the synchronous coordination mode (colors and symbols as in A). Note the cycle-to-cycle variability in the phase relation between the middle spike of a heart motor neuron and the MRR of movement in the corresponding heart segment. Note also that the intersegmental phase differences between the 2 motor neurons and those between the hearts of segments 8 and 12 vary. The gray box outlines the section of the recording shown in A.
Fig. 8.
Fig. 8.
Phase plots from 4 different in vivo preparations (Prep1–Prep4; minimally dissected) to show the duty cycles for the heart motor neurons [HE(8), gray; HE(12), dark green] and for the corresponding heart segments [heart(8), white; heart(12), light green] in both modes (peristaltic, pink outlines; synchronous, blue outlines). Thick vertical lines in the HE and heart boxes correspond to the middle spike of the heart motor neurons and to the peak constriction in the heart segments, respectively; left edges are the first spike (motor neurons) and the start of constriction (heart segments); right edges are the last spike (motor neurons) and end of the relaxation (heart segments); the MRR of constriction is shown as the thin line between the start of the constriction and its peak (all with SD). Phase marker is the HE(8) motor neuron (0 phase). Intraburst instantaneous spike frequencies (binned in 0.02 phase intervals) are centered around the middle spike for the corresponding motor neuron and are placed above the HE(8) motor neuron and below the HE(12) motor neuron. The horizontal dashed line corresponds to 10 Hz and the vertical bar to 5 Hz. The cycle period (±SD) and the number of cycles analyzed are given for each plot. Prep1 is that shown in Fig. 7. Note that all patterns are clearly rear-to-front peristaltic or synchronous (i.e., nearly simultaneous). Note also that the MRR of constriction varies with respect to the middle spike of its motor neuron, as does the phase difference realized by motor neurons and hearts.
Fig. 9.
Fig. 9.
Phase relations between the heart motor neurons' firing rates and the MRR of constrictions in vivo (minimally dissected animals). A: phase relation of the maximum intraburst spike frequency and the MRR of constriction for heart segments 8 (top; circles) and 12 (bottom; diamonds) with respect to the middle spike of the corresponding heart motor neuron (dashed vertical line). The phases of the maximum intraburst spike frequency and the MRR of constriction for each individual experiment are connected by lines. Thick horizontal lines represent the average duty cycle (from first to last spike) across experiments of each heart motor neuron in each mode. The maximum intraburst spike frequency (filled symbols above the duty cycle) and the MRR of constriction (open symbols below the duty cycle) cluster around the middle spike of the corresponding heart motor neuron burst for both coordination modes and both segments. Note that the MRR of constriction of heart(8) occurs significantly later with respect to the middle spike in the peristaltic than in the synchronous mode (paired t-test). B: the phase differences between the middle spike of the HE(8) motor neuron and the MRR of constriction of heart(8) are plotted over the phase differences between the HE(12) motor neuron and the MRR of constriction of heart(12) for the peristaltic (pink triangles) and the synchronous (blue squares) coordination modes for the same experiments. The unity line represents equal phase differences in both segments. Note that in the peristaltic mode constriction of heart(8) is delayed with respect to the middle spike of the HE(8) heart motor neuron in 7 of the 9 preparations.
Fig. 10.
Fig. 10.
Example experiment showing a skipped heartbeat: extracellular recordings from 2 ipsilateral HE motor neurons and movement recordings of the heart segments they control (peristaltic coordination mode) in vivo (minimally dissected animals). Note that the 3rd burst of the HE(12) motor neuron has fewer spikes and a lower intraburst spike frequency compared with the others and that the corresponding heart segment does not constrict in this cycle.
Fig. 11.
Fig. 11.
Intersegmental phase differences between the HE(8) and HE(12) motor neurons and between constriction of the corresponding hearts positively correlate in the peristaltic mode in vivo (solid line: regression line; P ≤ 0.015) (A) but do not correlate in the synchronous coordination mode (B). The (dashed) identity line represents equal phase differences between the 2 motor neurons and the 2 hearts. Note that, across preparations, in the synchronous mode the phase differences between the constrictions of the 2 hearts vary more than those between the bursts of the motor neurons. Note also that in 7 of the 9 preparations in the peristaltic mode the phase differences between the 2 heart segments exceed those of the heart motor neurons. Each symbol represents the mean ± SD of the phase differences for several beat cycles (see methods).
Fig. 12.
Fig. 12.
Comparison of the data of this study (in vivo) and of recent work in isolated nerve cords (in vitro; Norris et al. 2011). Box-and-whisker plots represent the intersegmental phase differences between bursts in the HE heart motor neurons (phase marker: middle spike) and heart constrictions (phase marker: MRR of constriction) of segments 8 and 12 for the peristaltic mode (top, pink outlines, A–D) and for the synchronous mode (bottom, blue outlines, E–H). Outliers are marked as red crosses. Phase differences between the heart motor neurons of segments 8 and 12 obtained in vitro do not differ from those recorded in vivo in the peristaltic mode (compare C and D) but are different in the synchronous mode (compare G and H). Phase differences between the hearts of segments 8 and 12 do not differ in the 2 in vivo preparations (compare A and B and E and F, respectively). Note that in imaged leeches the synchronous phase progression of heart constrictions matched closely the motor neuron phase progression observed in vitro in both variability and median phase difference (compare E and H). For further details see text.

References

    1. Arbas EA. Rate modification in the heartbeat central pattern generator of the medicinal leech. J Comp Physiol A 155: 783–794, 1984
    1. Arbas EA, Calabrese RL. Leydig neuron activity modulates heartbeat in the medicinal leech. J Comp Physiol A 167: 665–671, 1990 - PubMed
    1. Brezina V, Orekhova IV, Weiss KR. The neuromuscular transform: the dynamic, nonlinear link between motor neuron firing patterns and muscle contraction in rhythmic behaviors. J Neurophysiol 83: 207–231, 2000 - PubMed
    1. Calabrese RL. The neural control of alternate heartbeat coordination states in the leech, Hirudo medicinalis. J Comp Physiol A 122: 11–143, 1977
    1. Calabrese RL. The roles of endogenous membrane properties and synaptic interaction in generating the heartbeat rhythm of the leech, Hirudo medicinalis. J Exp Biol 82: 163–176, 1979 - PubMed

Publication types

LinkOut - more resources