

An empirical comparison of key statistical attributes among potential ICU quality indicators
- PMID: 24717464
- PMCID: PMC4212919
- DOI: 10.1097/CCM.0000000000000334
An empirical comparison of key statistical attributes among potential ICU quality indicators
Abstract
Objective: Good quality indicators should have face validity, relevance to patients, and be able to be measured reliably. Beyond these general requirements, good quality indicators should also have certain statistical properties, including sufficient variability to identify poor performers, relative insensitivity to severity adjustment, and the ability to capture what providers do rather than patients' characteristics. We assessed the performance of candidate indicators of ICU quality on these criteria. Indicators included ICU readmission, mortality, several length of stay outcomes, and the processes of venous-thromboembolism and stress ulcer prophylaxis provision.
Design: Retrospective cohort study.
Setting: One hundred thirty-eight U.S. ICUs from 2001-2008 in the Project IMPACT database.
Patients: Two hundred sixty-eight thousand eight hundred twenty-four patients discharged from U.S. ICUs.
Interventions: None.
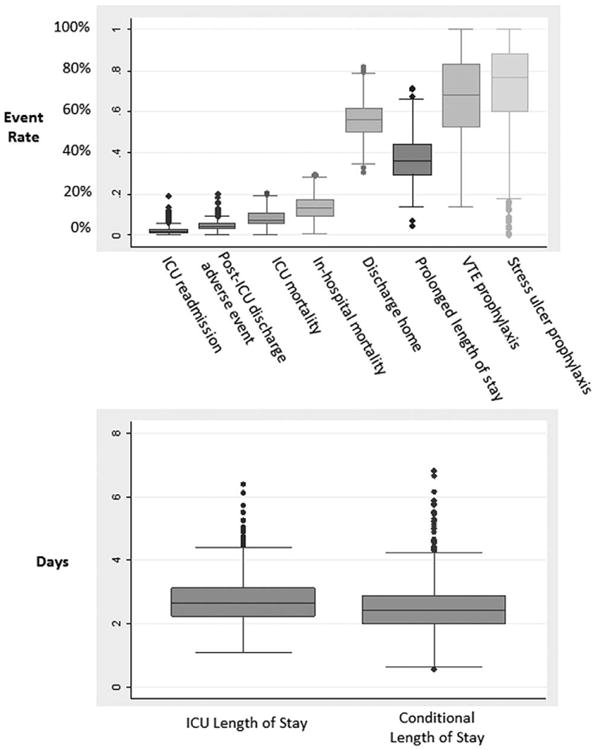
Measurements and main results: We assessed indicators' (1) variability across ICU-years; (2) degree of influence by patient vs. ICU and hospital characteristics using the Omega statistic; (3) sensitivity to severity adjustment by comparing the area under the receiver operating characteristic curve (AUC) between models including vs. excluding patient variables, and (4) correlation between risk adjusted quality indicators using a Spearman correlation. Large ranges of among-ICU variability were noted for all quality indicators, particularly for prolonged length of stay (4.7-71.3%) and the proportion of patients discharged home (30.6-82.0%), and ICU and hospital characteristics outweighed patient characteristics for stress ulcer prophylaxis (ω, 0.43; 95% CI, 0.34-0.54), venous thromboembolism prophylaxis (ω, 0.57; 95% CI, 0.53-0.61), and ICU readmissions (ω, 0.69; 95% CI, 0.52-0.90). Mortality measures were the most sensitive to severity adjustment (area under the receiver operating characteristic curve % difference, 29.6%); process measures were the least sensitive (area under the receiver operating characteristic curve % differences: venous thromboembolism prophylaxis, 3.4%; stress ulcer prophylaxis, 2.1%). None of the 10 indicators was clearly and consistently correlated with a majority of the other nine indicators.
Conclusions: No indicator performed optimally across assessments. Future research should seek to define and operationalize quality in a way that is relevant to both patients and providers.
Figures
Comment in
-
Quality indicators: not everything that can be counted counts*.Crit Care Med. 2014 Aug;42(8):1946-7. doi: 10.1097/CCM.0000000000000459. Crit Care Med. 2014. PMID: 25029135 No abstract available.
Similar articles
-
Are readmissions to the intensive care unit a useful measure of hospital performance?Med Care. 1999 Apr;37(4):399-408. doi: 10.1097/00005650-199904000-00009. Med Care. 1999. PMID: 10213020
-
The Utility of ICU Readmission as a Quality Indicator and the Effect of Selection.Crit Care Med. 2018 May;46(5):749-756. doi: 10.1097/CCM.0000000000003002. Crit Care Med. 2018. PMID: 29394182
-
Who bounces back? Physiologic and other predictors of intensive care unit readmission.Crit Care Med. 2001 Mar;29(3):511-8. doi: 10.1097/00003246-200103000-00008. Crit Care Med. 2001. PMID: 11373413
-
Predictive ability of the stability and workload index for transfer score to predict unplanned readmissions after ICU discharge.Crit Care Med. 2013 Jul;41(7):1608-15. doi: 10.1097/CCM.0b013e31828a217b. Crit Care Med. 2013. PMID: 23660731
-
Mortality and length-of-stay outcomes, 1993-2003, in the binational Australian and New Zealand intensive care adult patient database.Crit Care Med. 2008 Jan;36(1):46-61. doi: 10.1097/01.CCM.0000295313.08084.58. Crit Care Med. 2008. PMID: 18090383
Cited by
-
Use of Life Support and Outcomes Among Patients Admitted to Intensive Care Units.JAMA. 2025 May 27;333(20):1793-1803. doi: 10.1001/jama.2025.2163. JAMA. 2025. PMID: 40227733
-
Comparing the Contributions of Acute and Postacute Care Facility Characteristics to Outcomes After Hospitalization for Hip Fracture.Med Care. 2017 Apr;55(4):411-420. doi: 10.1097/MLR.0000000000000664. Med Care. 2017. PMID: 27811551 Free PMC article.
-
Importance of the National Early Warning Score (NEWS) at the time of discharge from the intensive care unit.Turk J Med Sci. 2020 Aug 26;50(5):1203-1209. doi: 10.3906/sag-1906-78. Turk J Med Sci. 2020. PMID: 32659876 Free PMC article.
-
Machine Learning for Benchmarking Critical Care Outcomes.Healthc Inform Res. 2023 Oct;29(4):301-314. doi: 10.4258/hir.2023.29.4.301. Epub 2023 Oct 31. Healthc Inform Res. 2023. PMID: 37964452 Free PMC article.
-
Variation in Case-Mix Adjusted Unplanned Pediatric Cardiac ICU Readmission Rates.Crit Care Med. 2018 Dec;46(12):e1175-e1182. doi: 10.1097/CCM.0000000000003440. Crit Care Med. 2018. PMID: 30252712 Free PMC article.
References
-
- National Research Council. Statement on Quality of Care. Washington, DC: The National Academies Press; 1998. - PubMed
-
- Brook RH, McGlynn EA, Cleary PD. Quality of health care. Part 2: Measuring quality of care. N Engl J Med. 1996;335:966–970. - PubMed
-
- Donabedian A. Explorations in Quality Assessment and Monitoring Vol 1 The Definition of Quality and Approaches to Its Assessment. Ann Arbor, MI: Health Administration Press; 1980.
-
- Donabedian A. Explorations in Quality Assessment and Monitoring Vol 2 The Definition of Quality and Approaches to Its Assessment. Ann Arbor, MI: Health Administration Press; 1982.
Publication types
MeSH terms
Grants and funding
LinkOut - more resources
Full Text Sources
Other Literature Sources
