. 2014 Jun;6(2):024109-24109.
doi: 10.1088/1758-5082/6/2/024109. Epub 2014 Apr 10.

Controlling the structural and functional anisotropy of engineered cardiac tissues

Affiliations

Controlling the structural and functional anisotropy of engineered cardiac tissues

W Bian et al. Biofabrication. 2014 Jun.

Abstract

The ability to control the degree of structural and functional anisotropy in 3D engineered cardiac tissues would have high utility for both in vitro studies of cardiac muscle physiology and pathology as well as potential tissue engineering therapies for myocardial infarction. Here, we applied a high aspect ratio soft lithography technique to generate network-like tissue patches seeded with neonatal rat cardiomyocytes. Fabricating longer elliptical pores within the patch networks increased the overall cardiomyocyte and extracellular matrix alignment within the patch. Improved uniformity of cell and matrix alignment yielded an increase in anisotropy of action potential propagation and faster longitudinal conduction velocity (LCV). Cardiac tissue patches with a higher degree of cardiomyocyte alignment and electrical anisotropy also demonstrated greater isometric twitch forces. After two weeks of culture, specific measures of electrical and contractile function (LCV = 26.8 ± 0.8 cm s(-1), specific twitch force = 8.9 ± 1.1 mN mm(-2) for the longest pores studied) were comparable to those of neonatal rat myocardium. We have thus described methodology for engineering of highly functional 3D engineered cardiac tissues with controllable degree of anisotropy.


Figures

Figure 1
Figure 1
Structural properties of engineered cardiac tissue patch networks. (A1-A3) Representative light microscopy images of two-week old non-porous patches (A1) and tissue networks fabricated with indicated post lengths (PL) of 0.6mm (A2) and 1.2mm (A3). (B1-B3) Corresponding cardiac tissue patches shown removed from PDMS molds. The patches were cultured anchored within nylon frames. (C-E) Morphometric parameters of two-week old patches including average length and width of patch pores (C), pore length-to-width (L/W) ratio (D) and patch thicknesses (E). n = 4-9 patches per group. #significant difference between two denoted groups. *significant difference from other two groups.
Figure 2
Figure 2
Cell alignment in engineered cardiac tissue patches. (A1-A3) Representative filamentous actin (F-act) stainings of control (non-porous) tissue patches (A1) and tissue networks with PL = 0.6 mm (A2) and PL = 1.2 mm (A3). (B1-B3) Corresponding close-up confocal stack images with side and front projections showing cellular organization within the bundle regions marked by yellow boxes in A. DAPI labels cell nuclei. (C) Representative map of fiber alignment in a rectangular sub-unit of a PL =1.2 mm patch, with blue lines indicating fiber angles within each 50 um tissue region. (D-E) Degrees of cell alignment within bundle regions (D) and entire tissue patch (global alignment, E). n = 6-12 patches per group. *significant difference from other two groups.
Figure 3
Figure 3
Distribution of cells and extracellular matrix in engineered cardiac tissue patches. (A1-A2) Representative macroscopic distribution of vimentin (Vim)+ fibroblasts and F-actin (F-act)+ cardiomyocytes in a control non-porous patch (A1) and bundle segment of a PL = 1.2 mm network patch (A2). Cross-sectional projections on the top show cellular distribution throughout the patch thickness. (B1-B2) Macroscopic distribution of collagen I (Col 1) in tissue patches corresponds to that of fibroblasts. (C-D) Microscopic distribution of collagen I (C1-C2) and F-act+ cardiomyocytes (D1,D2) in tissue patches. (E-F) Microscopic distribution of laminin (Lam, E1-E2) and F-act+ cardiomyocytes (F1,F2) in tissue patches. DAPI labels cell nuclei.
Figure 4
Figure 4
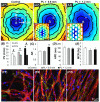
Electrical properties of engineered cardiac tissue patches. (A1-A3) Representative activation maps of action potential propagation in control (A1), PL = 0.6 mm (A2), and PL = 1.2 mm (A3) tissue patches. Pulse signs denote position of stimulus electrode. Isochrone lines are labeled in ms. Arrows show directions of measurement for longitudinal and transverse conduction velocity (LCV and TCV, respectively). Insets in (A2) and (A3) show representative activation maps (isochrone lines spaced 5 ms) recorded by a CMOS camera at higher spatial resolution, distinguishing the acellular pores from the surrounding tissue area. (B-D) Summary data for conduction velocity (CV, B), velocity anisotropy ratio (AR= LCV/TCV, C), and action potential duration (APD, D) in cardiac tissue patches stimulated at 2 Hz. (E) Maximum capture rate (MCR) defined as fastest pacing rate able to elicit a 1:1 response from engineered cardiac tissue. n = 9-13 patches per group. #significant difference between two denoted groups. *significant difference from other two corresponding groups. (F1-F3) Expression of connexin 43 (Cx43)+ gap junctions in sarcomeric a-actinin (SAA)+ cardiomyocytes in control patches (F1) and bundles of PL = 0.6 mm (F2) and PL = 1.2 mm (F3) tissue networks.
Figure 5
Figure 5
Contractile function of engineered cardiac tissue patches. (A) Average force-length relationships showing isometric twitch force amplitudes recorded during 1 Hz electrical stimulation at different tissue elongations (strains), with 0% elongation corresponding to culture length. (B) Maximum isometric twitch forces at optimal tissue elongation. (C) Passive tension in tissue patches as a function of tissue elongation. (D) Growth constants A of an exponential rise fit (y = −1+exp(x*A)) of data points shown in (C). (E-F) Kinetics of contractile force generation in tissue patches quantified via Rise time (from 10% to 90% of peak twitch force during onset of contraction, E) and Decay time (from 90% to 10% of peak twitch force during relaxation, F). n = 6-7 patches per group. *significant difference from other two groups.

References

    1. Donndorf P, Strauer BE, Haverich A, Steinhoff G. Stem cell therapy for the treatment of acute myocardial infarction and chronic ischemic heart disease. Current Pharmaceutical Biotechnology. 2013;14:12–19. - PubMed
    1. Anversa P, Kajstura J, Rota M, Leri A. Regenerating new heart with stem cells. Journal of Clinical Investigation. 2013;123:62–70. - PMC - PubMed
    1. Delewi R, Andriessen A, Tijssen JGP, Zijlstra F, Piek JJ, Hirsch A. Impact of intracoronary cell therapy on left ventricular function in the setting of acute myocardial infarction: A meta-analysis of randomised controlled clinical trials. Heart. 2013;99:225–232. - PubMed
    1. King A. Stem cells. Could it be time to abandon BMCs? Nature Reviews - Cardiology. 2013;10:8. - PubMed
    1. Marbán E, Malliaras K. Mixed results for bone marrow–derived cell therapy for ischemic heart disease. Journal of the American Medical Association. 2012;308:2405–2406. - PubMed

Publication types