Randomized Controlled Trial
. 2014 Apr 9;9(4):e91027.
doi: 10.1371/journal.pone.0091027. eCollection 2014.

A randomized pilot trial of a moderate carbohydrate diet compared to a very low carbohydrate diet in overweight or obese individuals with type 2 diabetes mellitus or prediabetes

Affiliations
Randomized Controlled Trial

A randomized pilot trial of a moderate carbohydrate diet compared to a very low carbohydrate diet in overweight or obese individuals with type 2 diabetes mellitus or prediabetes

Laura R Saslow et al. PLoS One. .

Abstract

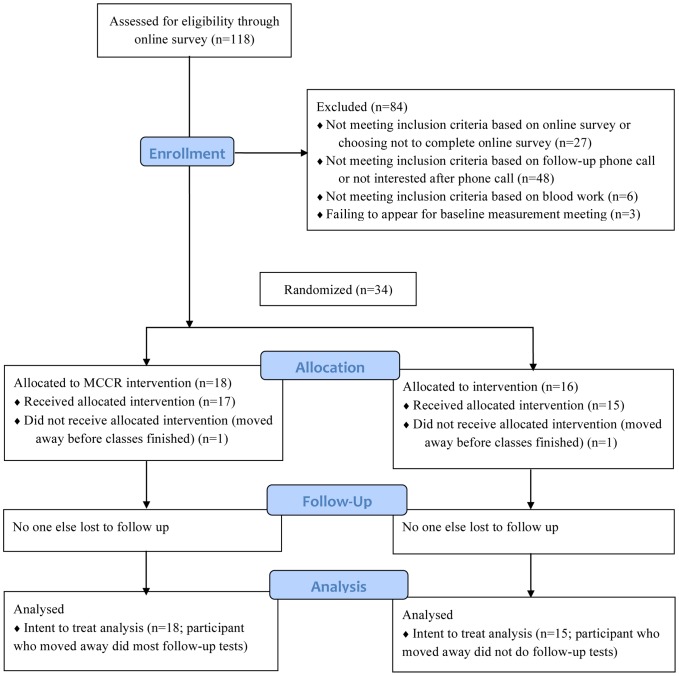
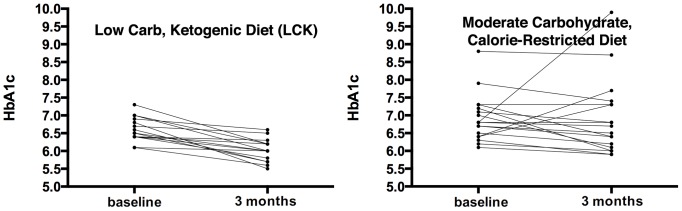
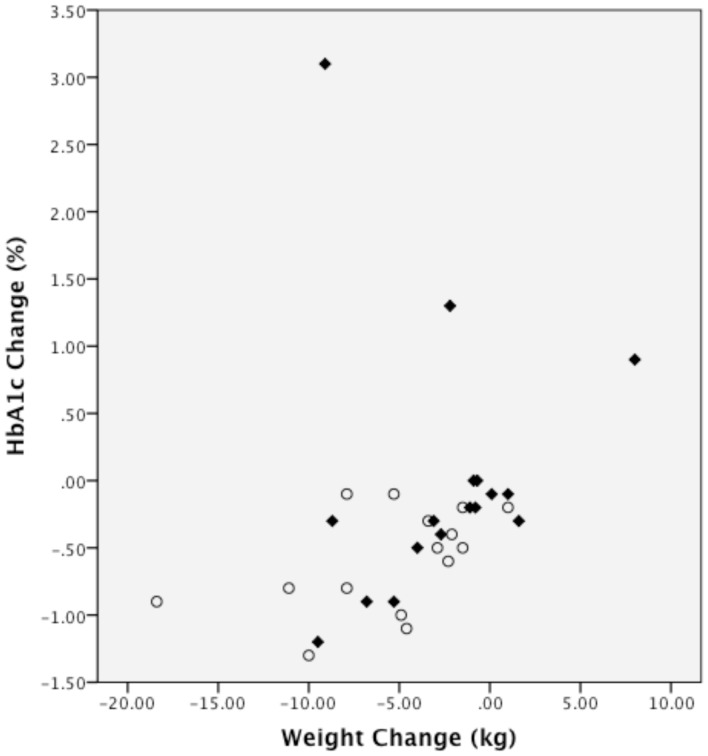
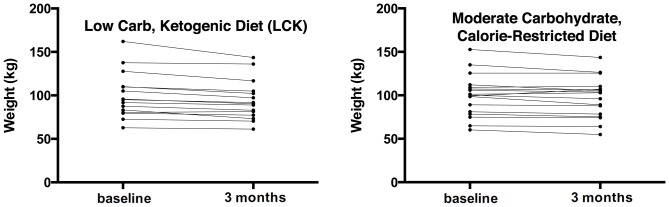
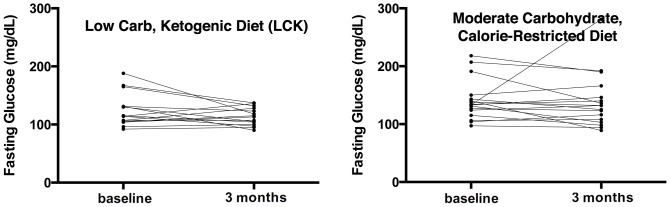
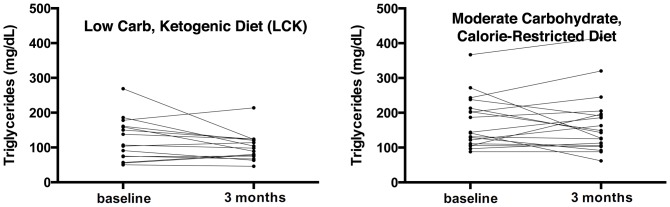
We compared the effects of two diets on glycated hemoglobin (HbA1c) and other health-related outcomes in overweight or obese adults with type 2 diabetes or prediabetes (HbA1c>6%). We randomized participants to either a medium carbohydrate, low fat, calorie-restricted, carbohydrate counting diet (MCCR) consistent with guidelines from the American Diabetes Association (n = 18) or a very low carbohydrate, high fat, non calorie-restricted diet whose goal was to induce nutritional ketosis (LCK, n = 16). We excluded participants receiving insulin; 74% were taking oral diabetes medications. Groups met for 13 sessions over 3 months and were taught diet information and psychological skills to promote behavior change and maintenance. At 3 months, mean HbA1c level was unchanged from baseline in the MCCR diet group, while it decreased 0.6% in the LCK group; there was a significant between group difference in HbA1c change favoring the LCK group (-0.6%, 95% CI, -1.1% to -0.03%, p = 0.04). Forty-four percent of the LCK group discontinued one or more diabetes medications, compared to 11% of the MCCR group (p = 0.03); 31% discontinued sulfonylureas in the LCK group, compared to 5% in the MCCR group (p = 0.05). The LCK group lost 5.5 kg vs. 2.6 kg lost in MCCR group (p = 0.09). Our results suggest that a very low carbohydrate diet coupled with skills to promote behavior change may improve glycemic control in type 2 diabetes while allowing decreases in diabetes medications. This clinical trial was registered with ClinicalTrials.gov, number NCT01713764.


Conflict of interest statement

Competing Interests: The authors have declared that no competing interests exist.

Figures

Figure 1
Figure 1. Study participant flowchart.
LCK = Low carbohydrate diet group. MCCR = Medium carbohydrate, low fat, calorie-restricted, carbohydrate counting diet.
Figure 2
Figure 2. Change in HbA1c by diet group.
Both panels show individual lines for the course of HbA1c from baseline to 3 months after intervention initiation for each trial participant. The left panel displays this data for the low carbohydrate diet group (mean change −0.6%), while the right presents the data for the moderate carbohydrate diet group (mean change 0%). See text for further discussion.
Figure 3
Figure 3. Relationship between change in hemoglobin A1c and change in weight.
The figure plots the change in HbA1c vs. the change in weight from baseline to 3 months for each individual (Spearman rank correlations: LCK = 0.45, p = 0.096; MCCR = 0.47, p = 0.055). The LCK group is shown as open circles; the MCCR group is shown as diamonds.
Figure 4
Figure 4. Change in weight by diet group.
Both panels show individual lines for the course of weight from baseline to 3 months after intervention initiation for each trial participant. The left panel displays this data for the low carbohydrate diet group (mean change −5.5 kg), while the right presents the data for the moderate carbohydrate diet group (mean change −2.6 kg).
Figure 5
Figure 5. Change in fasting glucose by diet group.
Both panels show individual lines for the course of fasting glucose from baseline to 3 months after intervention initiation for each trial participant. The left panel displays this data for the low carbohydrate diet group (mean change −11.1 mg/dL), while the right presents the data for the moderate carbohydrate diet group (mean change −1.2 mg/dL).
Figure 6
Figure 6. Change in triglycerides by diet group.
Both panels show individual lines for the course of triglycerides from baseline to 3 months after intervention initiation for each trial participant. The left panel displays this data for the low carbohydrate diet group (mean change −22.3 mg/dL), while the right presents the data for the moderate carbohydrate diet group (mean change −3.9 mg/dL).

References

    1. Peterson M (2013) Economic costs of diabetes in the US in 2012. Diabetes Care 36: 1033–1046. - PMC - PubMed
    1. Stratton IM, Adler AI, Neil HAW, Matthews DR, Manley SE, et al. (2000) Association of glycaemia with macrovascular and microvascular complications of type 2 diabetes (UKPDS 35): prospective observational study. Bmj 321: 405–412. - PMC - PubMed
    1. Association AD (2013) Standards of Medical Care in Diabetes - 2013. Diabetes Care 36: S11–S66. - PMC - PubMed
    1. Association AD (2009) All About Carbohydrate Counting.
    1. Accurso A, Bernstein RK, Dahlqvist A, Draznin B, Feinman RD, et al. (2008) Dietary carbohydrate restriction in type 2 diabetes mellitus and metabolic syndrome: time for a critical appraisal. Nutrition & metabolism 5: 9. - PMC - PubMed

Publication types

MeSH terms

Associated data