Comparative Study
. 2014 Jun 15;306(12):F1534-43.
doi: 10.1152/ajprenal.00585.2013. Epub 2014 Apr 9.

Individuality of the plasma sodium concentration

Affiliations
Comparative Study

Individuality of the plasma sodium concentration

Zheng Zhang et al. Am J Physiol Renal Physiol. .

Abstract

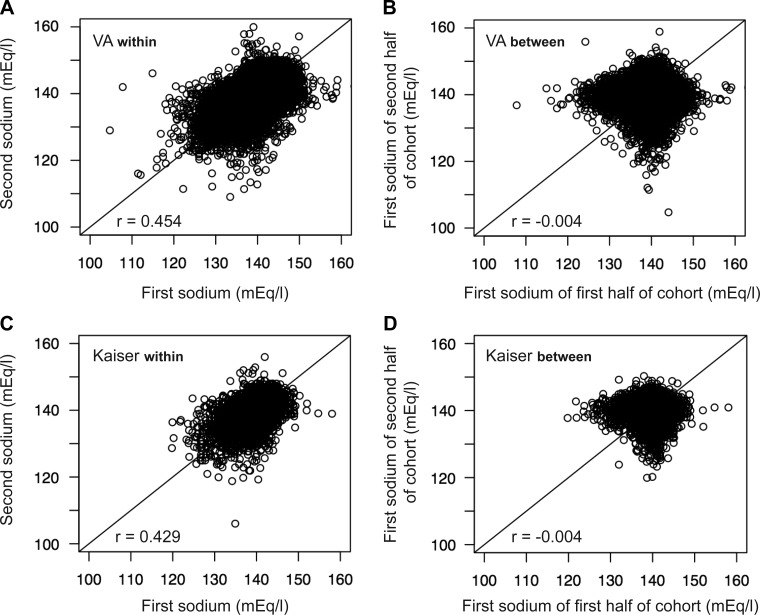
Older literature has suggested that the plasma sodium concentration is not individual, that it is neither intrinsic to an individual nor reproducible, longitudinally. We recently observed that the plasma sodium concentration is heritable. Because demonstrable heritability requires individuality of the relevant phenotype, we hypothesized that the plasma sodium concentration was substantially individual. In two large health plan-based cohorts, we demonstrated individuality of the plasma sodium concentration over a 10-yr interval; the intraclass correlation coefficient (ICC) averaged 0.4-0.5. The individuality of plasma sodium increased significantly with age. Plasma sodium individuality was equal to or only slightly less than that for plasma glucose but was less than the individuality for creatinine. The individuality of plasma sodium was further confirmed by comparing the Pearson correlation coefficient for within-individual versus between-individual pairs of sodium determinations and via application of the agreement index. Furthermore, the distribution of all sodium determinations for all participants within a population was similar to the distribution for the mean sodium concentration for individuals within that population. Therefore, the near-normal distribution of plasma sodium measurements within a population is likely not attributable to assay-specific factors but rather to genuine and durable biological variability in the osmotic set point. In aggregate, these data strongly support the individuality of the plasma sodium concentration. They further indicate that serial plasma sodium values for any given individual tend to cluster around a patient-specific set point and that these set points vary among individuals.

Keywords: human; hyponatremia; osmoregulation; population.


Figures

Fig. 1.
Fig. 1.
The concept of individuality of the plasma sodium concentration ([sodium]). A: distribution of plasma [sodium] among hypothetical subjects 1–5 showing individuality (i.e., within-individual “relatedness”) of [sodium], particularly among subjects 2 and 3. B: actual distribution of plasma [sodium] determinations in one study participant as a function of relative time [in days (d)] spanning nearly a decade. The laboratory-reported normal range for plasma [sodium] during this interval is shown by the gray shading.
Fig. 2.
Fig. 2.
Intraclass corrrelation coefficients (ICC) for transformed plasma [sodium] in the Veterans Affairs (VA; A) and Kaiser (B) cohorts. Because the ICC can only be applied across participants with an equal number of measurements, the ICC calculation was stratified on the number of determinations (n = 2–20 for the VA cohort and n = 2–8 for the Kaiser cohort) for this and all subsequent figures. For n > 20 in the VA cohort (e.g., the final data point in A), only the first 21 sodium measurements were used; similarly, for n > 8 in the Kaiser cohort, only the first 9 measurements were used for the calculation. For this figure and all subsequent figures, error bars depict 95% confidence intervals for the ICC.
Fig. 3.
Fig. 3.
ICCs for transformed plasma [sodium] after stratification on sex in the VA (A) and Kaiser (B) cohorts. In A, data reflecting <50 participants per number of determinations (i.e., n > 13 sodium determinations in female VA participants) were omitted as uninformative owing to wide confidence intervals.
Fig. 4.
Fig. 4.
ICCs for transformed plasma [sodium] after stratification on race in the VA (A) and Kaiser (B) cohorts. Data reflecting <50 participants per number of determinations [i.e., n > 15 and n > 4 sodium determinations in African-American VA participants (A) and African-American Kaiser participants (B), respectively] were omitted as uninformative owing to wide confidence intervals.
Fig. 5.
Fig. 5.
ICCs for transformed plasma [sodium] after stratification on age in the VA (A) and Kaiser (B) cohorts. For this analysis, there were two age strata: age ≥ 65 yr and age < 65 yr.
Fig. 6.
Fig. 6.
ICCs for transformed plasma [sodium] after stratification on age by decade in the VA and Kaiser cohorts. Decades are defined as participant age (in yr) at the time of first plasma sodium determination.
Fig. 7.
Fig. 7.
ICCs for plasma creatinine and glucose concentrations in the VA and Kaiser cohorts. These data were obtained to place the sodium data for ICCs in a clinical context. ICCs for glucose either approximated (VA cohort) or modestly exceeded that for sodium (Kaiser cohort), depending on the cohort. The ICC for creatinine exceeded those for sodium and glucose.
Fig. 8.
Fig. 8.
Scatterplots depicting within-individual and between-individual correlation of plasma [sodium] in the VA and Kaiser cohorts. For within-individual correlation (A and C), the first sodium determination (chronologically) for an individual (x-axis) was plotted against the second sodium determination for that same individual (y-axis); therefore, there as many data points as there are study participants (n = 143,973 for the VA cohort and n = 30,216 for the Kaiser cohort). For n > 2 sodium determinations, only the first and second sodium determinations were used for this analysis; therefore, it was less comprehensive than the ICC calculation. The Pearson correlation coefficient (r) calculated for these data was 0.454 for the VA cohort and 0.429 for the Kaiser cohort, indicating significant within-individual relatedness of [sodium]. This was also reflected in the relative proximity of data points to the depicted identity lines in A and C. For comparison purposes, the between-individual correlation for plasma [sodium] was also determined (B and D) by first dividing each cohort in half (creating subcohort A-half and subcohort B-half) by study-specific participant identification numbers. The first sodium determination for the first participant in the subcohort A-half of each cohort was plotted against the first sodium determination for the first participant in the subcohort B-half of the cohort. This process was repeated for the first sodium determination for each nth participant in the subcohort A-half versus the nth participant in the subcohort B-half; therefore, the number of data points in B and D is half the number of data points in A and C, respectively. r values for these between-individual data revealed no correlation (r = −0.004 for each cohort), indicating no relatedness of [sodium] between participants.
Fig. 9.
Fig. 9.
Agreement index for plasma sodium, glucose, and creatinine in the VA and Kaiser cohorts as a function of participant age (by decade, expressed in yr). The range for the agreement index was 0.5–1.0, where 0.5 represents no agreement/correlation and 1.0 represents perfect agreement/correlation within each class (e.g., for data from each participant; see text). Plots for [sodium] use dashed connecting lines for greater visibility.
Fig. 10.
Fig. 10.
Histograms showing the distribution of all transformed sodium determinations for the entire cohort (all sodium) and of the per-participant average sodium values (all participants) for the VA (A) and Kaiser (B) cohorts. The all sodiums data include all individual plasma sodium determinations for all participants in the cohort; the all participants data include a single value for each participant, where that value is the mean of all plasma sodium determinations for that patient. The y-axis depicts density, the fraction of values represented by each bar (total = 1.00, or 100%); the x-axis is plasma [sodium] in 1-meq/l intervals. The distribution of average [sodium] for each participant is similar to the distribution for all sodium determinations. A left-sided (hyponatremic) tail was evident in both distributions and in both cohorts.

Comment in

References

    1. Adrogue HJ, Madias NE. Hyponatremia. N Engl J Med 342: 1581–1589, 2000 - PubMed
    1. Allison SP, Lobo DN. Fluid and electrolytes in the elderly. Curr Opin Clin Nutr Metab Care 7: 27–33, 2004 - PubMed
    1. Ayus JC, Arieff AI. Abnormalities of water metabolism in the elderly. Semin Nephrol 16: 277–288, 1996 - PubMed
    1. Barr EL, Boyko EJ, Zimmet PZ, Wolfe R, Tonkin AM, Shaw JE. Continuous relationships between non-diabetic hyperglycaemia and both cardiovascular disease and all-cause mortality: the Australian Diabetes, Obesity, and Lifestyle (AusDiab) study. Diabetologia 52: 415–424, 2009 - PubMed
    1. Beck LH. Changes in renal function with aging. Clin Geriatr Med 14: 199–209, 1998 - PubMed

Publication types

LinkOut - more resources