. 2014 Sep;63(9):1481-9.
doi: 10.1136/gutjnl-2013-306202. Epub 2014 Apr 9.

Targeting mTOR dependency in pancreatic cancer

Affiliations
Free PMC article

Targeting mTOR dependency in pancreatic cancer

Douglas C Morran et al. Gut. 2014 Sep.
Free PMC article

Abstract

Objective: Pancreatic cancer is a leading cause of cancer-related death in the Western world. Current chemotherapy regimens have modest survival benefit. Thus, novel, effective therapies are required for treatment of this disease.

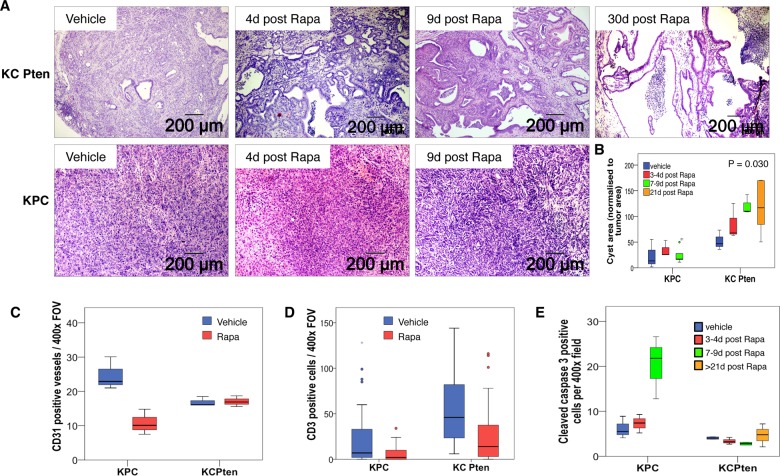
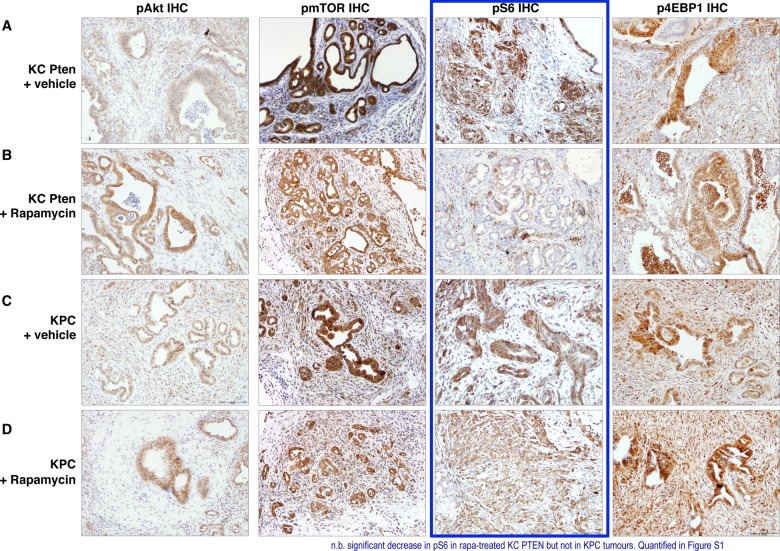
Design: Activating KRAS mutation almost always drives pancreatic tumour initiation, however, deregulation of other potentially druggable pathways promotes tumour progression. PTEN loss leads to acceleration of Kras(G12D)-driven pancreatic ductal adenocarcinoma (PDAC) in mice and these tumours have high levels of mammalian target of rapamycin (mTOR) signalling. To test whether these KRAS PTEN pancreatic tumours show mTOR dependence, we compared response to mTOR inhibition in this model, to the response in another established model of pancreatic cancer, KRAS P53. We also assessed whether there was a subset of pancreatic cancer patients who may respond to mTOR inhibition.

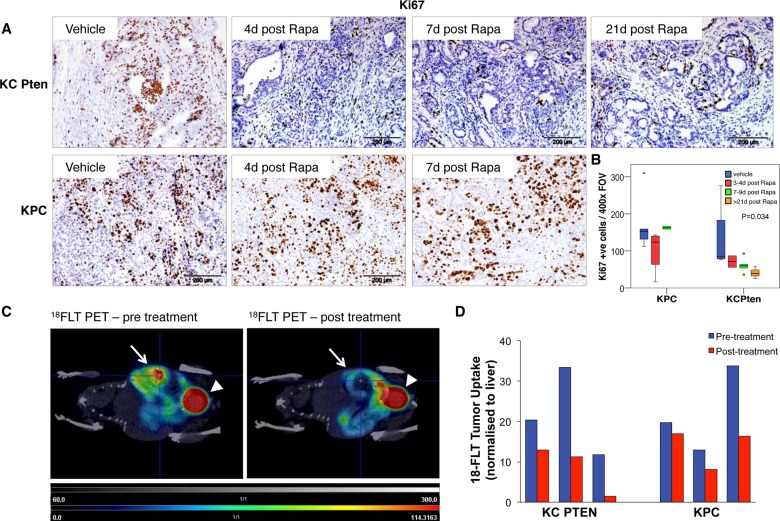
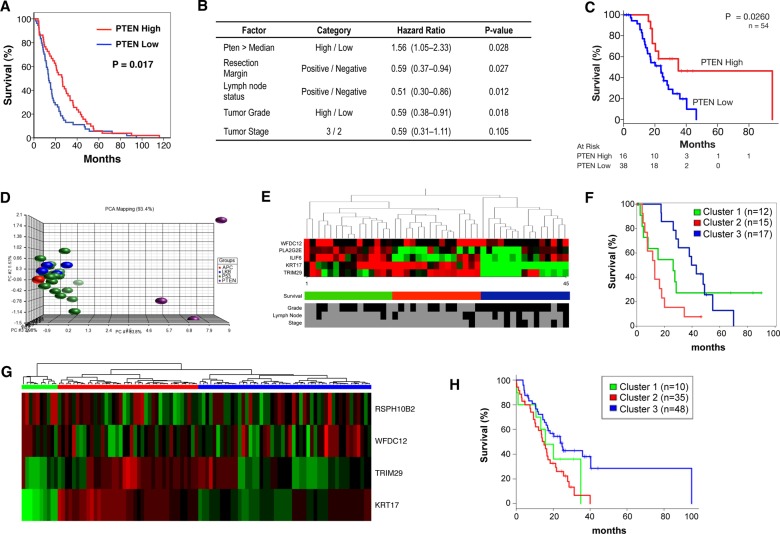
Results: We found that tumours in KRAS PTEN mice exhibit a remarkable dependence on mTOR signalling. In these tumours, mTOR inhibition leads to proliferative arrest and even tumour regression. Further, we could measure response using clinically applicable positron emission tomography imaging. Importantly, pancreatic tumours driven by activated KRAS and mutant p53 did not respond to treatment. In human tumours, approximately 20% of cases demonstrated low PTEN expression and a gene expression signature that overlaps with murine KRAS PTEN tumours.

Conclusions: KRAS PTEN tumours are uniquely responsive to mTOR inhibition. Targeted anti-mTOR therapies may offer clinical benefit in subsets of human PDAC selected based on genotype, that are dependent on mTOR signalling. Thus, the genetic signatures of human tumours could be used to direct pancreatic cancer treatment in the future.

Keywords: Cell Signalling; Genetics; Pancreatic Cancer; Pharmacogenomics.


Figures

Figure 1
Figure 1
Inhibition of mammalian target of rapamycin (mTOR) can delay tumorigenesis and improve survival even in late-stage PTEN-deficient pancreatic ductal adenocarcinoma (PDAC). (A) Kaplan–Meier survival curve showing that the survival of KC PTEN mice with symptomatic PDAC treated daily with either 10 mg/kg intraperitoneal rapamycin as a single agent (n=18, red solid line), or in combination with twice weekly 100 mg/kg intraperitoneal gemcitabine (n=9, red dashed line), was significantly increased compared with either vehicle control treated mice (n=6, blue solid line), or with gemcitabine treated mice (n=5, blue dashed line). (B) Kaplan–Meier survival curve showing that the survival of KPC mice with symptomatic PDAC treated daily with 10 mg/kg intraperitoneal rapamycin (n=16, red line), was not significantly increased compared with vehicle control treated mice (n=8, blue solid line). (C) Chart showing the change in tumour volume between the start of rapamycin treatment and the time of sacrifice (days of treatment on x-axis) in KC PTEN mice (blue bars) compared with KPC mice (red bars). (D) Ultrasound images of a pancreatic tumour in a KC PTEN mouse prior to and post-treatment. (E) Ultrasound images of a pancreatic tumour in a KPC mouse prior to and post-treatment.
Figure 2
Figure 2
Mammalian target of rapamycin (mTOR) inhibition can induce tumour regression in Pten-deficient pancreatic ductal adenocarcinoma (PDAC). (A) H&E-stained sections of PDAC harvested from mice treated with vehicle or 10 mg/kg rapamycin for 4, 9 or 30 days, as indicated. Cyst formation is observed, and increases with time on treatment in KC PTEN mice (upper panels), but not in KPC mice (lower panels). (B) Boxplot showing quantification of cyst area as normalised to the total tumour area. (C) Boxplot showing quantification of the number of CD31-positive vessels per 400× field of view in sections from rapamycin treated (red bars) or vehicle treated (blue bars) KC PTEN or KPC mice, as indicated. (D) Boxplot showing quantification of the number of CD3 positive cells per 400× field of view in sections from rapamycin treated (red bars) or vehicle treated (blue bars) KC PTEN or KPC mice, as indicated. (E) Graph showing quantification of the number of cleaved caspase 3 positive cells per 400× field of view in sections from rapamycin, or vehicle treated KC PTEN or KPC mice, as indicated (blue=vehicle, red=3–4 days rapamycin, green=7–9 days rapamycin, orange=>21 days rapamycin). 10 fields were assessed per mouse and at least three mice for each treatment group.
Figure 3
Figure 3
Mammalian target of rapamycin (mTOR) inhibition abrogates proliferation in Pten-deficient pancreatic ductal adenocarcinoma (PDAC). (A) Immunohistochemical staining for the proliferation marker Ki67 showing that rapamycin treatment results in a marked inhibition of proliferation in KC PTEN mice (upper panels), but not in KPC mice (lower panels). Sections from tumours harvested at the indicated time-points are shown here. (B) Graph showing quantification of the number of Ki67 positive cells per 400× field of view in sections from rapamycin or vehicle treated KC PTEN or KPC mice, as indicated. Ten fields were assessed per mouse, and at least 3 mice for each treatment group (blue=vehicle, red=3–4 days rapamycin, green=7–9 days rapamycin, orange=21+ days rapamycin). (C) Representative coronal plane 18F-3′-Fluoro-3′-deoxy-L-Thymidine (18FLT) positron emission tomography (PET)-CT images show the PET signal emitted from the pancreatic tumour (white arrows) as well as excreted tracer in the bladder (arrowheads) in a KC PTEN mouse at time of presentation (left panel), and after 4 days rapamycin treatment (right panel). (D) Graph of 18FLT uptake in KC PTEN and KPC tumours before, and following rapamycin treatment, based on maximum Standardised Uptake Value (SUVMax) in region of interest, and normalised to liver (n=3).
Figure 4
Figure 4
Mammalian target of rapamycin (mTOR) inhibition with rapamycin acts primarily through S6K. (A–D) Immunohistochemical analysis of pAKT, pmTOR, pS6 and 4EBP1 levels in vehicle and rapamycin treated KC PTEN and KPC tumours as indicated. Note the significant reduction in staining intensity of pS6 following rapamycin treatment in KC PTEN tumours, but not KPC tumours (highlighted in blue).
Figure 5
Figure 5
Low PTEN and expression of a low PTEN-associated signature predicts poor survival in human PDAC. (A) Kaplan–Meier analysis showing that cases with low Pten expression (n=59) have poorer outcomes compared with those with high expression (n=58, p=0.013), in the Glasgow cohort. (B) Table showing that by multivariate analysis, low PTEN expression is an independent predictor of survival. (C) Kaplan–Meier analysis showing that cases with low Pten expression (n=38) have poorer outcomes compared to those with high expression (n=16, p=0.026), in the Australian cohort as well. (D) Principal component analysis (PCA) of gene expression data generated from tumours in KC PTEN, KPC and Pdx1-Cre, KrasG12D/+ Lkb1fl/+ and Pdx1-Cre, KrasG12D/+ Apcfl/+ mice. This PCA was used to generate a gene expression signature specific to PTEN-deficient tumours. (E) Heat map showing that the PTEN-deficient signature could be used to delineate 3 groups of patients when applied to gene expression data from human PDAC patients (Glasgow cohort). Selected clinical data for the 45 patients is shown including tumour grade (low vs high) tumour stage (2 vs 3), lymph node involvement (negative vs positive). Black indicates low or negative, while grey indicates high or positive values. (F) Kaplan–Meier analysis showing human PDAC cases from the Glasgow cohort delineated on the basis of gene expression of low PTEN-associated signature. Cases with high expression of this signature (red, n=15) have significantly decreased survival compared to those with medium (green, n=15, p=0.1) or low expression (blue, n=15, p<0.0001, Log-Rank test). (G) Heat map showing validation of the PTEN-deficient signature used to delineate 3 groups of patients when applied to gene expression data from human pancreatic cancer patients (Australia cohort). (H) Kaplan–Meier curves showing difference of overall survival between 3 groups of patients identified by the PTEN-deficient signature in the Australia cohort (log-rank p=0.01).

Comment in

References

    1. http://info.Cancerresearchuk.Org/cancerstats/types/pancreas/mortality/in....
    1. Burris HA, III, Moore MJ, Andersen J, et al. Improvements in survival and clinical benefit with gemcitabine as first-line therapy for patients with advanced pancreas cancer: a randomized trial. J Clin Oncol 1997;15:2403–13 - PubMed
    1. Conroy T, Desseigne F, Ychou M, et al. FOLFIRINOX versus gemcitabine for metastatic pancreatic cancer. N Engl J Med 2011;364:1817–25 - PubMed
    1. Biankin AV, Waddell N, Kassahn KS, et al. Pancreatic cancer genomes reveal aberrations in axon guidance pathway genes. Nature 2012;491:399–405 - PMC - PubMed
    1. Yachida S, Jones S, Bozic I, et al. Distant metastasis occurs late during the genetic evolution of pancreatic cancer. Nature 2010;467:1114–17 - PMC - PubMed

Publication types

MeSH terms