. 2014 Apr 10:5:3664.
doi: 10.1038/ncomms4664.

Correlated optical and isotopic nanoscopy

Affiliations
Free PMC article

Correlated optical and isotopic nanoscopy

Sinem K Saka et al. Nat Commun. .
Free PMC article

Abstract

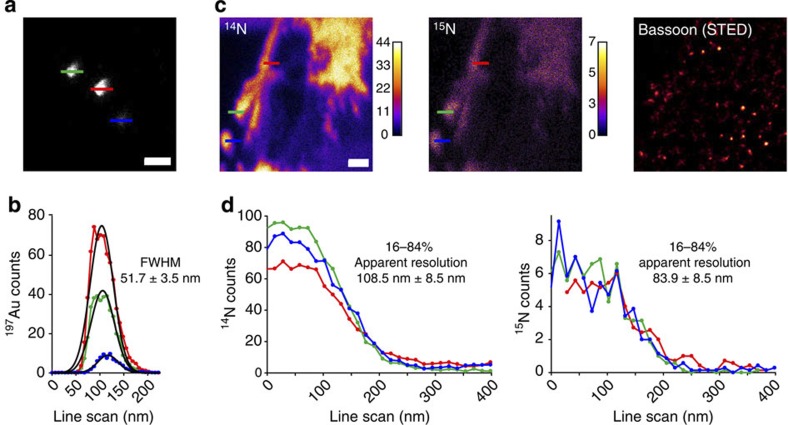
The isotopic composition of different materials can be imaged by secondary ion mass spectrometry. In biology, this method is mainly used to study cellular metabolism and turnover, by pulsing the cells with marker molecules such as amino acids labelled with stable isotopes ((15)N, (13)C). The incorporation of the markers is then imaged with a lateral resolution that can surpass 100 nm. However, secondary ion mass spectrometry cannot identify specific subcellular structures like organelles, and needs to be correlated with a second technique, such as fluorescence imaging. Here, we present a method based on stimulated emission depletion microscopy that provides correlated optical and isotopic nanoscopy (COIN) images. We use this approach to study the protein turnover in different organelles from cultured hippocampal neurons. Correlated optical and isotopic nanoscopy can be applied to a variety of biological samples, and should therefore enable the investigation of the isotopic composition of many organelles and subcellular structures.


Conflict of interest statement

François Hillion is an employee of Cameca, a company manufacturing SIMS instruments. All the other authors declare no competing financial interests.

Figures

Figure 1
Figure 1. The lateral resolution of SIMS imaging in neuronal samples.
(a) As a proof-of-principle experiment, upper surfaces of 100 nm gold particles embedded in gelatin were scanned by SIMS. Three particles are indicated. Scale bar, 200 nm. (b) The line scans from panel a are plotted. Gaussian fits to the line scans provide a full-width-at-half-maximum of ~50 nm. The use of a different definition for the image resolution, the signal drop from 84 to 16% of the maximum (which has been frequently used for SIMS624) indicates an even higher resolution, of ~33 nm. (c) SIMS analysis: 14N and 15N images from an axonal area. A STED image of this area shows the immunolabelling for the active zone marker protein bassoon. The STED image was processed with deconvolution. Scale bar, 500 nm. (d) Line scans were performed on the SIMS images from panel c, in the areas indicated by the coloured bars. The resolution, calculated using the 16–84% criterion, is shown as an average of the three line scans±s.d.
Figure 2
Figure 2. The depth resolution of SIMS imaging in neuronal samples.
(a) SIMS images were collected repeatedly in one neuronal area. The sample is slowly eroded, which allows the production of images from progressively deeper layers. A Z-stack of the sample is obtained. For simplicity, only the 14N images are shown. The 200-nm-thick sample was eroded over 35 images, which indicates that, on average, a sample layer of 5.7 nm is eroded for each image. Scale bar, 500 nm. (b) We analysed the signal changes in three areas, indicated by the coloured circles in the first image in panel a (for clarity, the circles are omitted in the following images). Circular regions of interest were used, with a diameter of 152 nm (20 pixels). The signal intensity for each of the three regions of interest (ROI) is shown (averaged for all pixels in each circular regions of interest). Signal changes occur over 2–4 SIMS images. Therefore, according to the 16–84% criterion, the depth resolution is (at most) 11.4–23 nm (as individual images correspond to a depth of 5.7 nm, as indicated above).
Figure 3
Figure 3. Correlated STED and SIMS imaging in neuronal axons.
(a) Light microscopy images of a neuronal axon section. The neuron was immunostained for the mitochondrial marker TOMM20 (green, confocal), for the synaptic vesicle marker synaptophysin 1 (red, confocal), and for the active zone marker bassoon (blue, confocal). The overlay of three confocal images is shown. Bassoon staining was also imaged using STED microscopy. All images were processed by deconvolution. Arrowheads indicate a synapse, where all three labels colocalize. Scale bar, 2 μm. (b) SIMS images of the same axon for 14N, 15N and 15N 14N ratio, respectively. Note the high 15N/14N ratio in the synapse region identified by immunostainings (arrowhead). The natural terrestrial ratio is 0.00367 (ref. 6). (c) The bars indicate the 15N/14N ratios in the synapse region indicated above and in the rest of the axon, respectively. (d) A high-zoom view of the synapse region in the STED channel. Different clusters of bassoon molecules identified within the synapse are numbered 1 to 9. Their respective 15N/14N average ratio values (+s.e.m.) are plotted in the graph. Numbers in parentheses indicate the number of pixels in each cluster. Note that four of the nine clusters have higher ratios (>0.065), while the other ones have lower ratios (~0.055). (e,f) The panel shows the histograms of the clusters in panel d. A K-means clustering approach (performed in Matlab) confirmed that the low- and high-ratio clusters build two different groups. This can also be conformed by inspecting the average histograms for the two groups of clusters (f). The difference between the means of the two groups is statistically significant (t-test, P=0.00078). Scale bar, 250 nm. (g) The clusters in d visualized in confocal mode. Only two clusters can be identified, with relatively similar 15N/14N ratios. (h) The histograms for the two confocal clusters in g.
Figure 4
Figure 4. Correlated STED and SIMS imaging in neuronal cell bodies.
(a) Light microscopy images of a neuronal cell body section. The neuron was immunostained for the Golgi marker TGN38 (green, confocal), for the synaptic vesicle marker synaptophysin 1 (red, confocal; synaptophysin 1 identifies vesicle precursors in the cell body), and for the ER marker calnexin (blue, confocal). The overlay of three confocal images is shown. Calnexin staining was also imaged using STED microscopy. All images were processed by deconvolution. Scale bar, 2 μm. (b) SIMS images for 14N, 15N and 15N/14N ratio, respectively. Note the low 15N/14N ratio in the nucleus (which is identified by its characteristic morphology, upper left corner of the image) and the presence of several cytosolic regions with higher ratios. (c) The graph shows the 15N/14N ratio for the different organelles. The values for the nucleus are significantly lower than those for all the other organelles (**, P<0.01, t-test). In addition, the ratio is significantly higher in the Golgi apparatus (TGN38) than in the ER (calnexin; *, P<0.05, t-test). The graphs represent mean+s.e.m., from 26, 57, 9, and 41 regions for the four bars, respectively. For each set of data we performed t-tests of the null hypothesis that data analysed were random samples from a normal distribution. The tests did not disprove the hypothesis (P=1). Sample variance was low: 1.16 × 10⁻⁵, 7.55 × 10⁻⁵, 3.57 × 10⁻⁵, 10.49 × 10⁻⁵ for the four bars, respectively. (d,e) Comparison between the ability of confocal and STED microscopy to determine accurate organelle outlines. The panels show an overlay of the Golgi apparatus (green) with the ER (red) in confocal imaging or in STED imaging, as double-coloured images (d) and as 3D views (e). Scale bar, 1 μm. The confocal image of the ER overlaps more extensively with that of the Golgi in comparison to the STED image. Therefore, correlation with STED enables much more accurate identification of the ER-free Golgi areas and allows measurement of the associated 15N signal. This suggests that SIMS measurements based on the STED image are more precise than those based on the confocal images. See also Supplementary Fig. 7 for a modelling study confirming this aspect.

References

    1. Johansson M. E. V. & Hansson G. C. Analysis of assembly of secreted mucins. Methods. Mol. Biol. 842, 109–121 (2012). - PubMed
    1. Dittrich A., Siewert E. & Schaper F. Determination of protein turnover rates in the Jak/STAT pathway using a radioactive pulse-chase approach. Methods. Mol. Biol. 967, 69–80 (2013). - PubMed
    1. Zhang J., Campbell R. E., Ting A. Y. & Tsien R. Y. Creating new fluorescent probes for cell biology. Nat. Rev. Mol. Cell. Biol. 3, 907–918 (2002). - PubMed
    1. Zhang L. et al. Method for real-time monitoring of protein degradation at the single cell level. Biotechniques 42, 446–450 (2007). - PubMed
    1. Hindie E., Coulomb B., Beaupain R. & Galle P. Mapping the cellular distribution of labelled molecules by SIMS microscopy. Biol. Cell. 74, 81–88 (1992). - PubMed

Publication types

MeSH terms