

Characterization of FLOWERING LOCUS T1 (FT1) gene in Brachypodium and wheat
- PMID: 24718312
- PMCID: PMC3981775
- DOI: 10.1371/journal.pone.0094171
Characterization of FLOWERING LOCUS T1 (FT1) gene in Brachypodium and wheat
Abstract
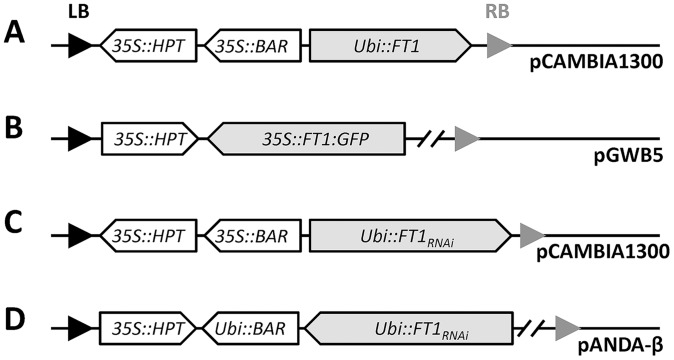
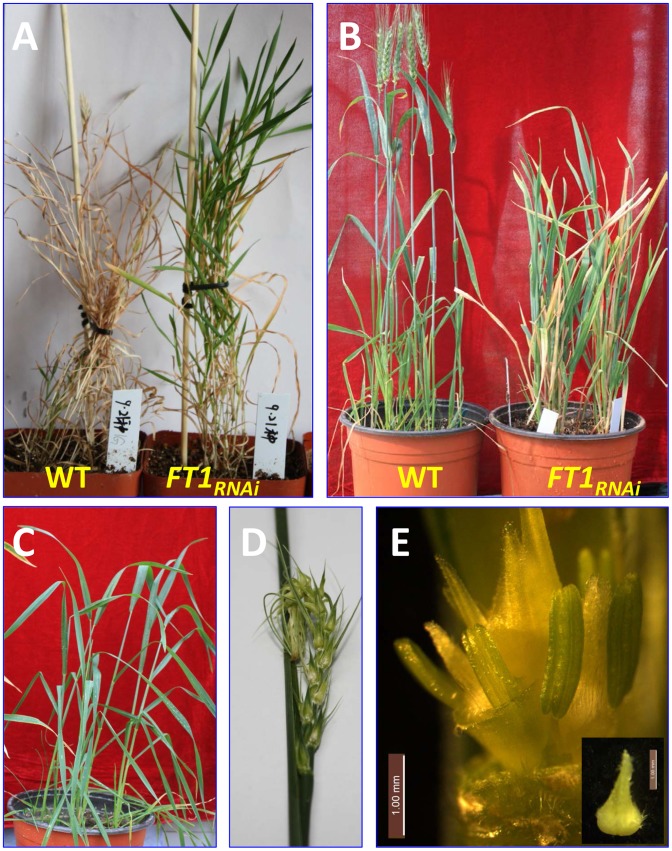
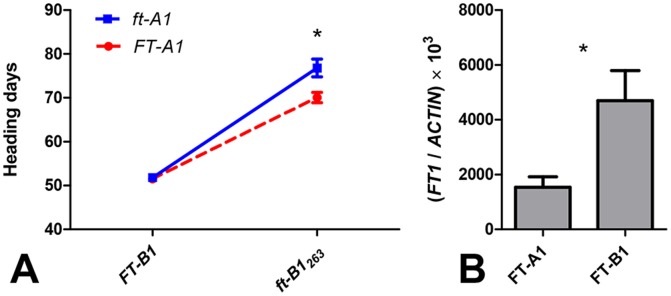
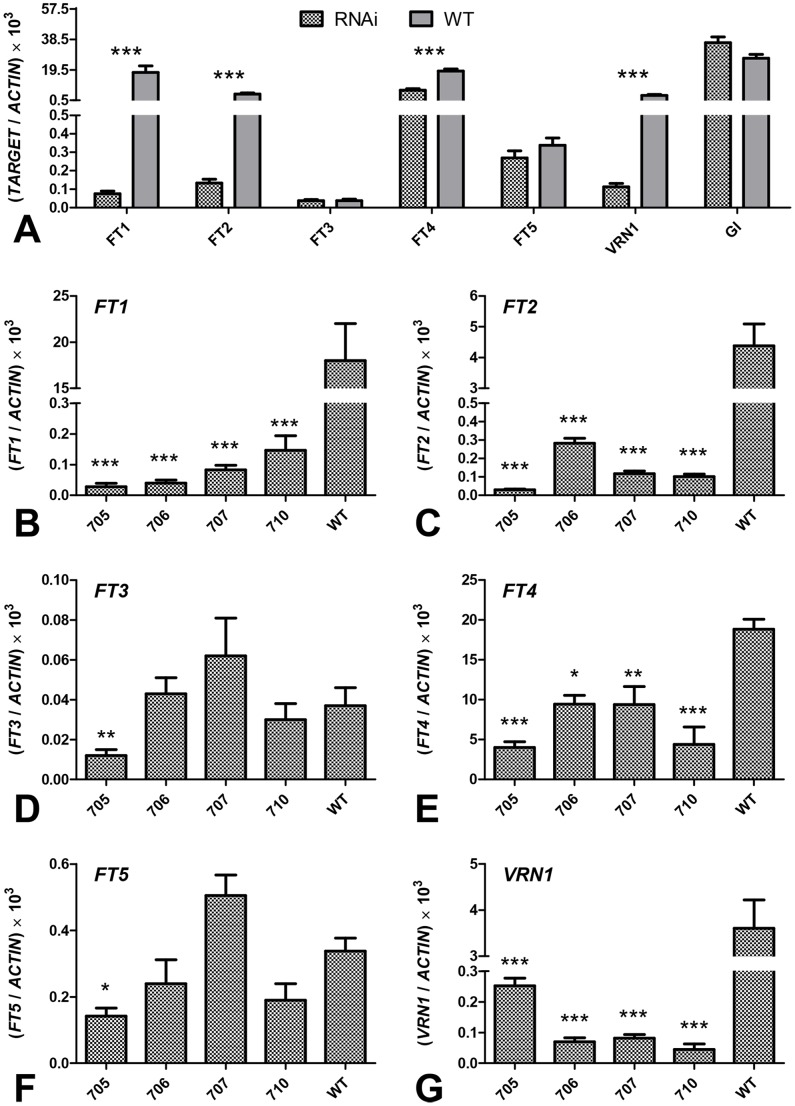
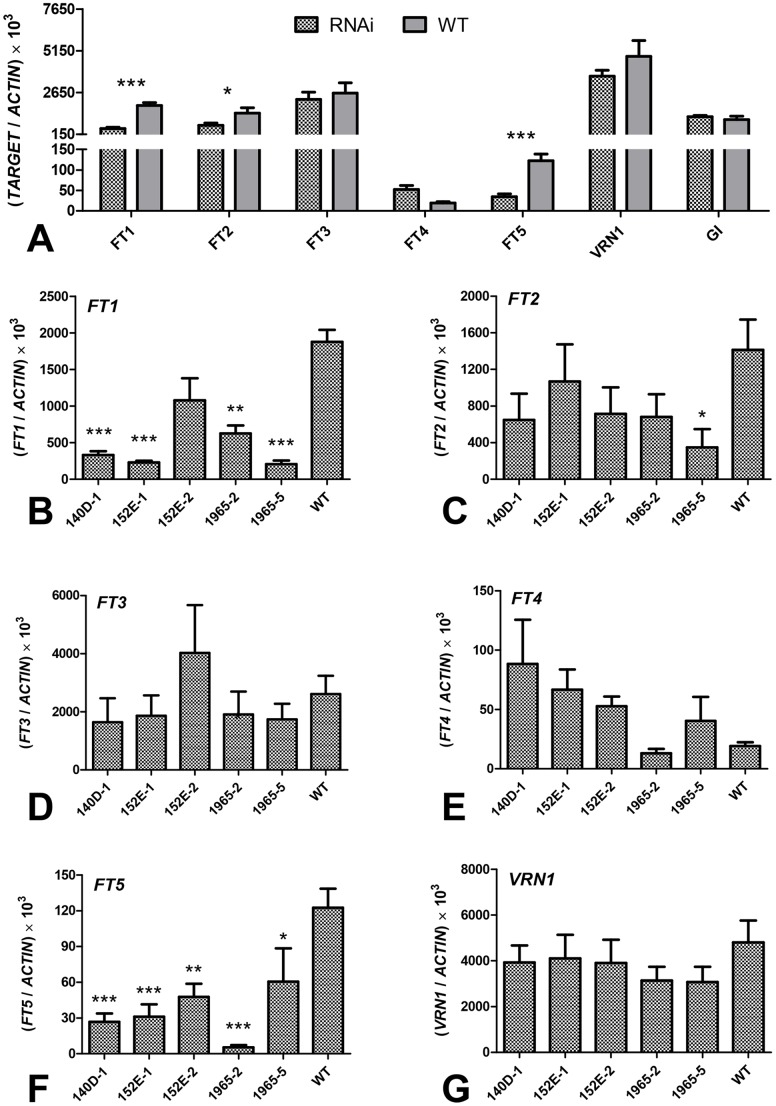
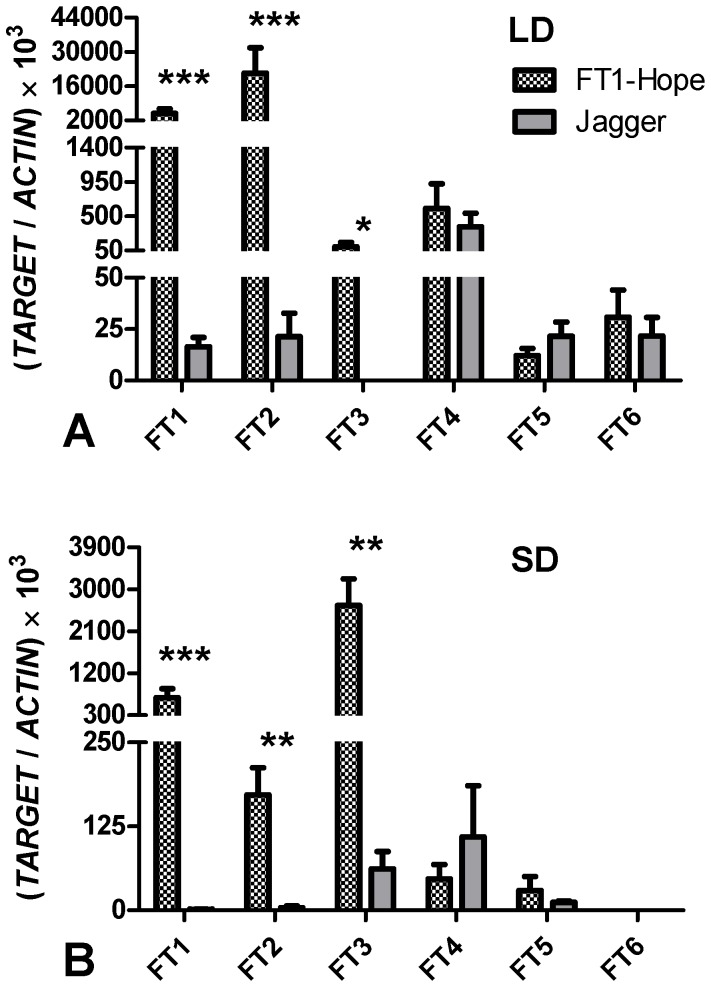
The phase transition from vegetative to reproductive growth is a critical event in the life cycle of flowering plants. FLOWERING LOCUS T (FT) plays a central role in the regulation of this transition by integrating signals from multiple flowering pathways in the leaves and transmitting them to the shoot apical meristem. In this study, we characterized FT homologs in the temperate grasses Brachypodium distachyon and polyploid wheat using transgenic and mutant approaches. Downregulation of FT1 by RNAi was associated with a significant downregulation of the FT-like genes FT2 and FT4 in Brachypodium and FT2 and FT5 in wheat. In a transgenic wheat line carrying a highly-expressed FT1 allele, FT2 and FT3 were upregulated under both long and short days. Overexpression of FT1 caused extremely early flowering during shoot regeneration in both Brachypodium and hexaploid wheat, and resulted in insufficient vegetative tissue to support the production of viable seeds. Downregulation of FT1 transcripts by RNA interference (RNAi) resulted in non-flowering Brachypodium plants and late flowering plants (2-4 weeks delay) in wheat. A similar delay in heading time was observed in tetraploid wheat plants carrying mutations for both FT-A1 and FT-B1. Plants homozygous only for mutations in FT-B1 flowered later than plants homozygous only for mutations in FT-A1, which corresponded with higher transcript levels of FT-B1 relative to FT-A1 in the early stages of development. Taken together, our data indicate that FT1 plays a critical role in the regulation of flowering in Brachypodium and wheat, and that this role is associated with the simultaneous regulation of other FT-like genes. The differential effects of mutations in FT-A1 and FT-B1 on wheat heading time suggest that different allelic combinations of FT1 homoeologs could be used to adjust wheat heading time to improve adaptation to changing environments.
Conflict of interest statement
Figures
Similar articles
-
FLOWERING LOCUS T2 regulates spike development and fertility in temperate cereals.J Exp Bot. 2019 Jan 1;70(1):193-204. doi: 10.1093/jxb/ery350. J Exp Bot. 2019. PMID: 30295847 Free PMC article.
-
INDETERMINATE1-mediated expression of FT family genes is required for proper timing of flowering in Brachypodium distachyon.Proc Natl Acad Sci U S A. 2023 Nov 14;120(46):e2312052120. doi: 10.1073/pnas.2312052120. Epub 2023 Nov 7. Proc Natl Acad Sci U S A. 2023. PMID: 37934817 Free PMC article.
-
Regulation of FT splicing by an endogenous cue in temperate grasses.Nat Commun. 2017 Feb 1;8:14320. doi: 10.1038/ncomms14320. Nat Commun. 2017. PMID: 28145403 Free PMC article.
-
The molecular biology of seasonal flowering-responses in Arabidopsis and the cereals.Ann Bot. 2009 Jun;103(8):1165-72. doi: 10.1093/aob/mcp063. Epub 2009 Mar 21. Ann Bot. 2009. PMID: 19304997 Free PMC article. Review.
-
Gene regulatory network and abundant genetic variation play critical roles in heading stage of polyploidy wheat.BMC Plant Biol. 2019 Jan 3;19(1):6. doi: 10.1186/s12870-018-1591-z. BMC Plant Biol. 2019. PMID: 30606101 Free PMC article. Review.
Cited by
-
RNA-seq studies using wheat PHYTOCHROME B and PHYTOCHROME C mutants reveal shared and specific functions in the regulation of flowering and shade-avoidance pathways.BMC Plant Biol. 2016 Jun 21;16(1):141. doi: 10.1186/s12870-016-0831-3. BMC Plant Biol. 2016. PMID: 27329140 Free PMC article.
-
High resolution mapping of restoration of fertility (Rf) by combining large population and high density genetic map in pigeonpea [Cajanus cajan (L.) Millsp].BMC Genomics. 2020 Jul 3;21(1):460. doi: 10.1186/s12864-020-06859-6. BMC Genomics. 2020. PMID: 32620075 Free PMC article.
-
Feeling the heat: developmental and molecular responses of wheat and barley to high ambient temperatures.J Exp Bot. 2020 Oct 7;71(19):5740-5751. doi: 10.1093/jxb/eraa326. J Exp Bot. 2020. PMID: 32667992 Free PMC article. Review.
-
Factorial combinations of protein interactions generate a multiplicity of florigen activation complexes in wheat and barley.Plant J. 2015 Oct;84(1):70-82. doi: 10.1111/tpj.12960. Epub 2015 Sep 6. Plant J. 2015. PMID: 26252567 Free PMC article.
-
FLOWERING LOCUS T2 regulates spike development and fertility in temperate cereals.J Exp Bot. 2019 Jan 1;70(1):193-204. doi: 10.1093/jxb/ery350. J Exp Bot. 2019. PMID: 30295847 Free PMC article.
References
-
- Brambilla V, Fornara F (2013) Molecular control of flowering in response to day length in rice. J Integr Plant Biol 55: 410–418. - PubMed
-
- Andrés F, Coupland G (2012) The genetic basis of flowering responses to seasonal cues. Nat Rev Genet 13: 627–639. - PubMed
-
- Distelfeld A, Li C, Dubcovsky J (2009) Regulation of flowering in temperate cereals. Curr Opin Plant Biol 12: 178–184. - PubMed
Publication types
MeSH terms
Substances
Grants and funding
LinkOut - more resources
Full Text Sources
Other Literature Sources
