. 2014 May;9(3):391.
doi: 10.1007/s12263-014-0391-9. Epub 2014 Apr 10.

Adipose tissue metabolism and inflammation are differently affected by weight loss in obese mice due to either a high-fat diet restriction or change to a low-fat diet

Affiliations

Adipose tissue metabolism and inflammation are differently affected by weight loss in obese mice due to either a high-fat diet restriction or change to a low-fat diet

Femke P M Hoevenaars et al. Genes Nutr. 2014 May.

Abstract

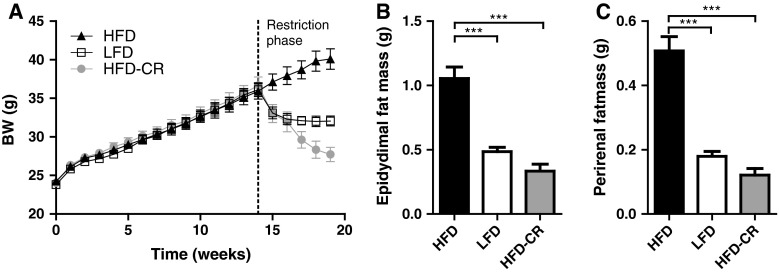
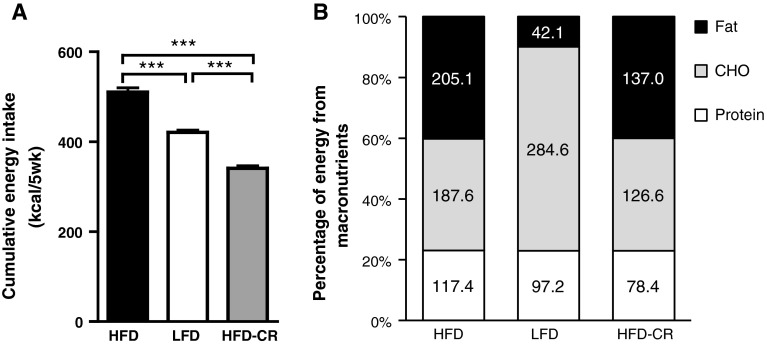
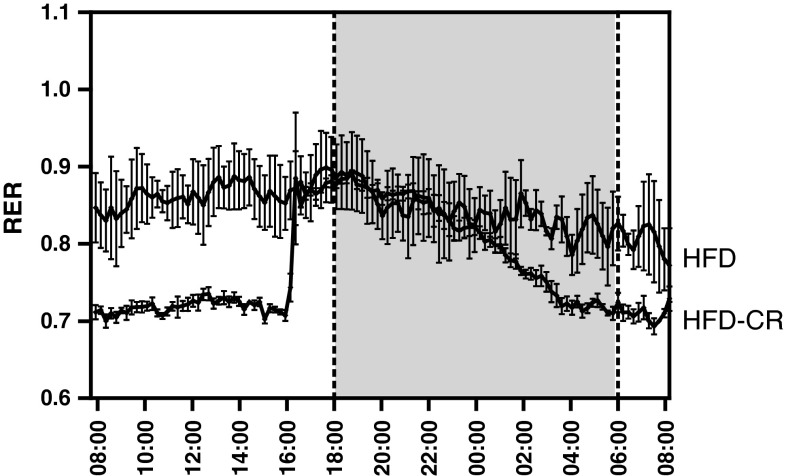
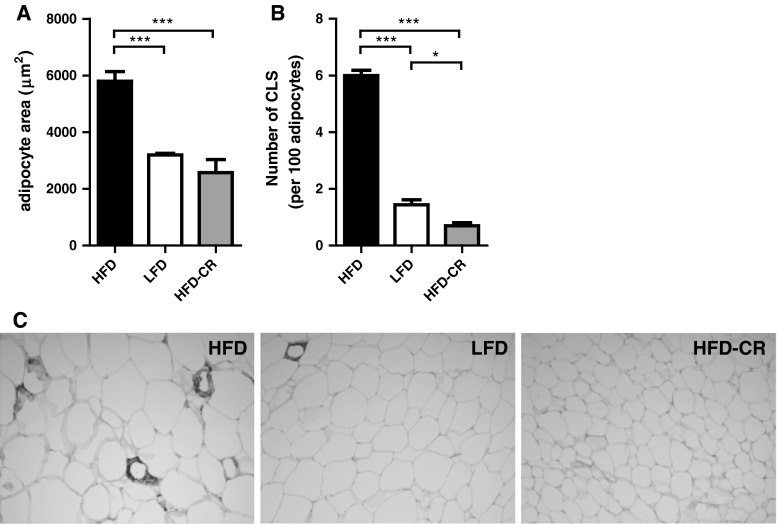
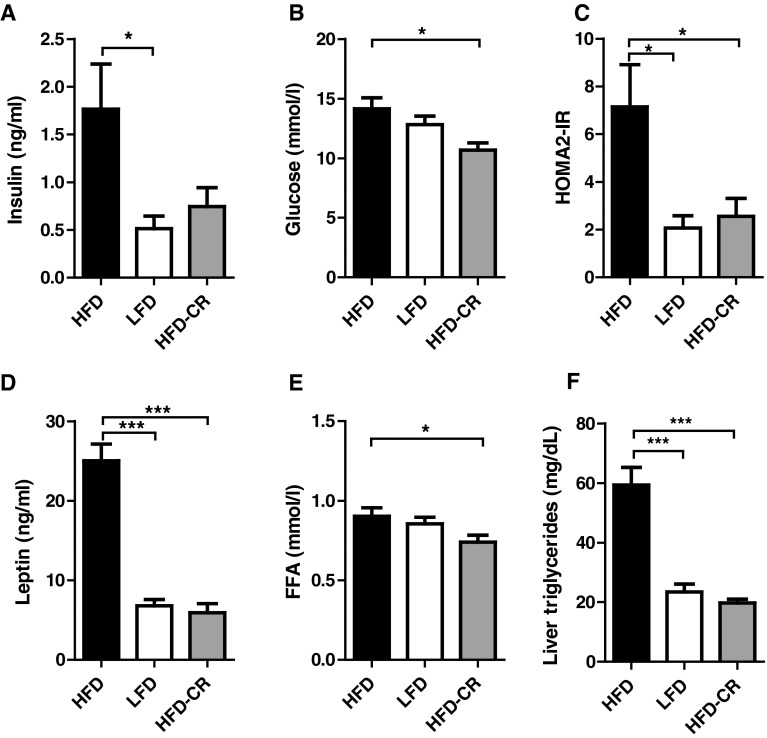
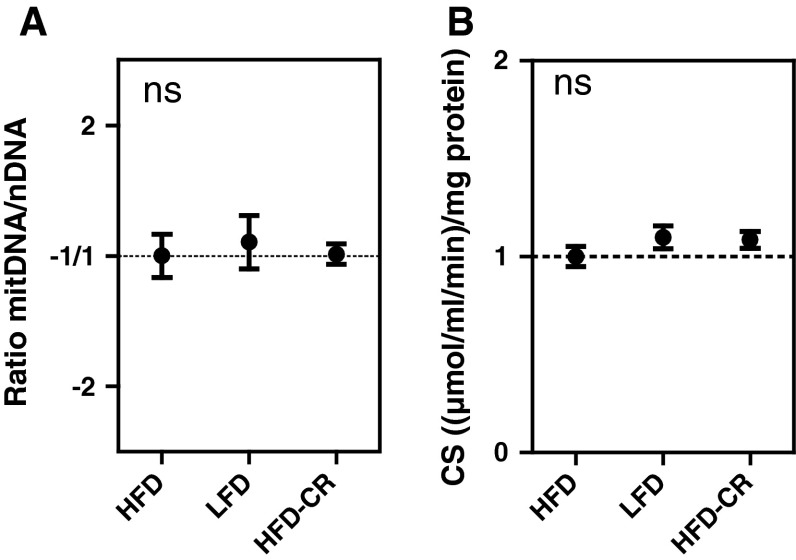
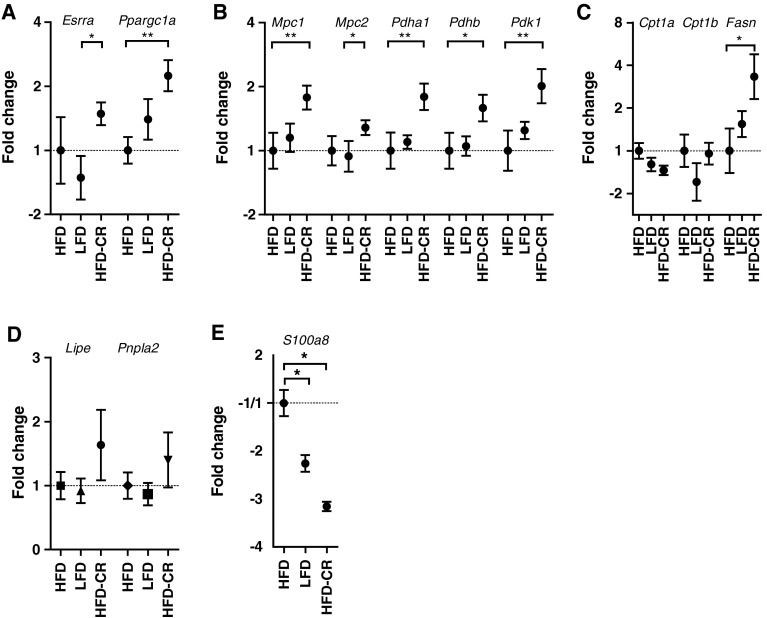
Restriction of a high-fat diet (HFD) and a change to a low-fat diet (LFD) are two interventions that were shown to promote weight loss and improve parameters of metabolic health in obesity. Examination of the biochemical and molecular responses of white adipose tissue (WAT) to these interventions has not been performed so far. Here, male C57BL/6JOlaHsd mice, harboring an intact nicotinamide nucleotide transhydrogenase gene, were fed a purified 40 energy% HFD for 14 weeks to induce obesity. Afterward, mice were divided into three dietary groups: HFD (maintained on HFD), LFD (changed to LFD with identical ingredients), and HFD-CR (restricted to 70 % of the HFD). The effects of the interventions were examined after 5 weeks. Beneficial effects were seen for both HFD-CR and LFD (compared to HFD) regarding physiological parameters (body weight and fat mass) and metabolic parameters, including circulating insulin and leptin levels. Macrophage infiltration in WAT was reduced by both interventions, although more effectively by HFD-CR. Strikingly, molecular parameters in WAT differed between HFD-CR and LFD, with increased activation of mitochondrial carbohydrate and fat metabolism in HFD-CR mice. Our results confirm that restriction of the amount of dietary intake and reduction in the dietary energy content are both effective in inducing weight loss. The larger decrease in WAT inflammation and increase in mitochondrial carbohydrate metabolism may be due to a larger degree of energy restriction in HFD-CR, but could also be due to superior effectiveness of dietary restriction in weight loss strategies.


Figures

Fig. 1
Fig. 1
Changes in body weight (a) and adipose tissue mass of 14-week DIO mice, followed by a 5-week diet intervention of ad libitum high-fat diet (40 en% fat, HFD), ad libitum low-fat diet (10 en% fat, LFD), or restricted high-fat diet (30 % restriction of HFD, HFD-CR). b, c Represent white adipose tissue mass of epididymal (b) and peri-renal (c) origin immediately post mortem. Data are mean ± SEM (n = 12). ***p < 0.001
Fig. 2
Fig. 2
Cumulative energy intake (a) and percentage of energy intake from macronutrients (b fat, carbohydrate (CHO), protein) during 5-week intervention. Numbers in bars represent corresponding energetic value (Kcal) of various macronutrients. Data are mean ± SEM (n = 12). ***p < 0.001
Fig. 3
Fig. 3
Respiratory exchange ratio (RER) of 14-week DIO mice, followed by a 5-week continuation of ad libitum high-fat diet (40 en% fat, HFD), or a 5-week restricted high-fat diet (30 % restriction of HFD, HFD-CR). Grey area represents the dark phase. Data are mean ± SEM (n = 3–6)
Fig. 4
Fig. 4
Adipose tissue morphology. a Mean adipocyte area after a 5-week diet intervention of high-fat ad libitum diet (40 en% fat, HFD), low-fat ad libitum (10 en% fat, LFD), or high-fat restriction (30 % restriction of HFD, HFD-CR). b Observed number of crown-like structures (CLS) expressed per 100 adipocytes, as a measure for macrophage infiltration. c Representative pictures of MAC-2-stained white adipose tissue for HFD, LFD, and HFD-CR. Data are mean ± SEM (n = 5–6). *p < 0.05, ***p < 0.001
Fig. 5
Fig. 5
Serum and tissue parameters. a Insulin levels, b glucose levels, c calculated HOMA2-IR insulin resistance index, d leptin levels, and e free fatty acids (FFA) levels in serum, and f triglyceride levels in liver of mice after a 5-week diet intervention of high-fat ad libitum diet (40 en% fat, HFD), low-fat ad libitum (10 en% fat, LFD), or high-fat restriction (30 % restriction of HFD, HFD-CR). Data are mean ± SEM (n = 12, except for liver triglycerides n = 8). *p < 0.05, ***p < 0.001
Fig. 6
Fig. 6
Mitochondrial density in eWAT after a 5-week diet intervention of high-fat ad libitum diet (40 en% fat, HFD), low-fat ad libitum (10 en% fat, LFD), or high-fat restriction (30 % restriction of HFD, HFD-CR) as measured by the mitochondrial DNA copy number versus the nuclear DNA by q-PCR and citrate synthase (CS) activity assay. Data are mean ± SEM (n = 10). Ratio of mtDNA/nDNA and CS activity levels of HFD mice was set to 1.0
Fig. 7
Fig. 7
Gene expression profiling after a 5-week diet intervention of high-fat ad libitum diet (40 en% fat, HFD), low-fat ad libitum (10 en% fat, LFD), or high-fat restriction (30 % restriction of HFD, HFD-CR) as measured by qRT-PCR on selected target genes. a Mitochondrial biogenesis (Esrra, Ppargc1a), b mitochondrial carbohydrate metabolism (Mpc1, Mpc2, Pdha1, Pdhb, and Pdk1), c fatty acid metabolism (Cpt1a, Cpt1b, and Fasn), d lipolysis (Lipe and Pnpla2), e and inflammation (S100a8)

References

    1. Abete I, Astrup A, Martinez JA, Thorsdottir I, Zulet MA. Obesity and the metabolic syndrome: role of different dietary macronutrient distribution patterns and specific nutritional components on weight loss and maintenance. Nutr Rev. 2010;68:214–231. doi: 10.1111/j.1753-4887.2010.00280.x. - DOI - PubMed
    1. Astrup A, Toubro S, Raben A, Skov AR. The role of low-fat diets and fat substitutes in body weight management: what have we learned from clinical studies? J Am Diet Assoc. 1997;97:S82–S87. doi: 10.1016/S0002-8223(97)00737-2. - DOI - PubMed
    1. Bruss MD, Khambatta CF, Ruby MA, Aggarwal I, Hellerstein MK. Calorie restriction increases fatty acid synthesis and whole body fat oxidation rates. Am J Physiol Endocrinol Metab. 2010;298:E108–E116. doi: 10.1152/ajpendo.00524.2009. - DOI - PMC - PubMed
    1. Burton BT, Foster WR, Hirsch J, Van Itallie TB. Health implications of obesity: an NIH consensus development conference. Int J Obes. 1985;9:155–170. - PubMed
    1. Chevalier L, Bos C, Azzout-Marniche D, Fromentin G, Mosoni L, Hafnaoui N, Piedcoq J, Tome D, Gaudichon C. Energy restriction only slightly influences protein metabolism in obese rats, whatever the level of protein and its source in the diet. Int J Obes (Lond) 2013;37:263–271. doi: 10.1038/ijo.2012.19. - DOI - PubMed

LinkOut - more resources