. 2014 Apr 9;281(1783):20132914.
doi: 10.1098/rspb.2013.2914. Print 2014 May 22.

Locomotor function shapes the passive mechanical properties and operating lengths of muscle

Affiliations

Locomotor function shapes the passive mechanical properties and operating lengths of muscle

E Azizi. Proc Biol Sci. .

Abstract

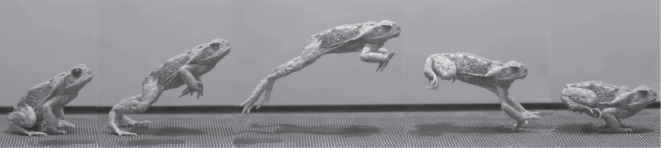
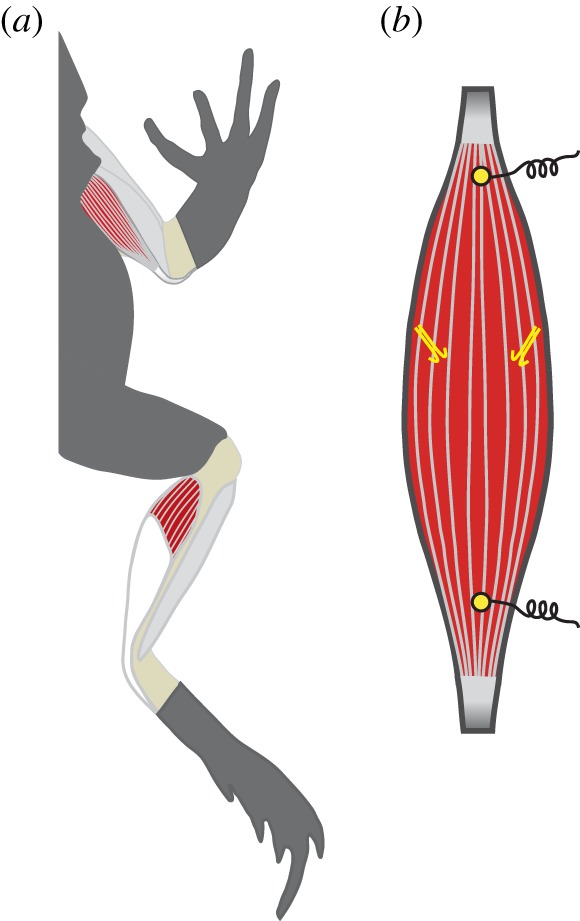
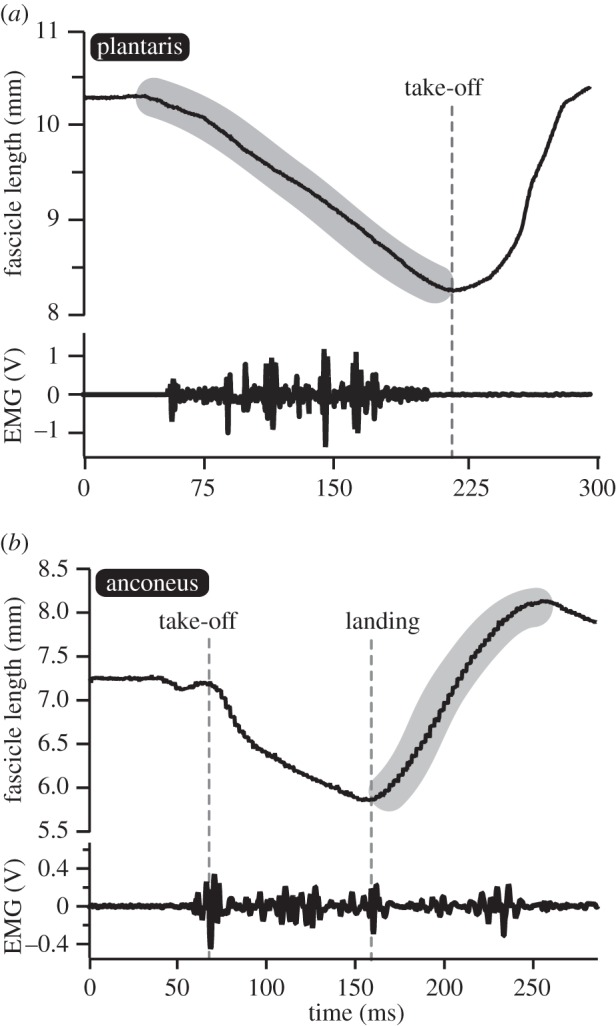
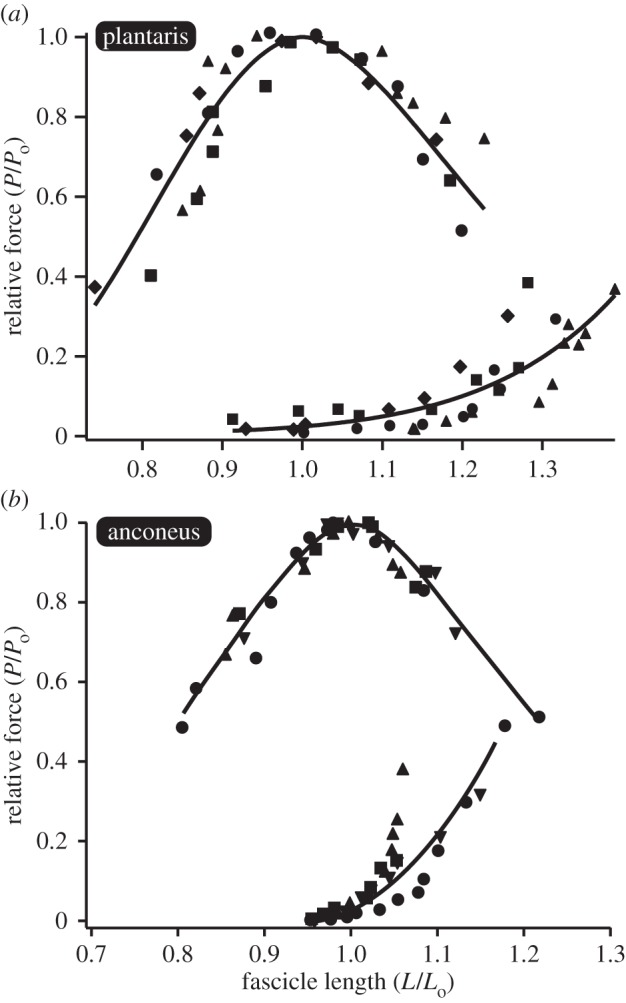
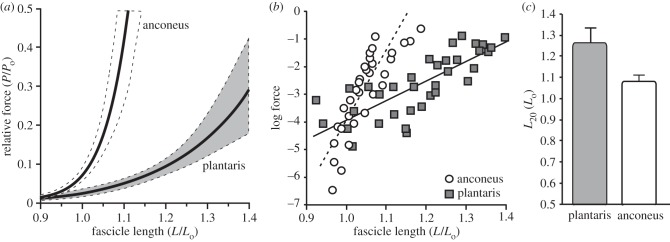
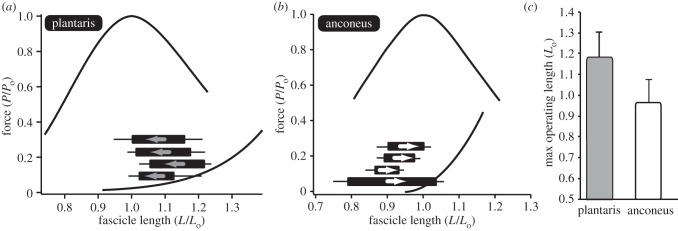
Locomotor muscles often perform diverse roles, functioning as motors that produce mechanical energy, struts that produce force and brakes that dissipate mechanical energy. In many vertebrate muscles, these functions are not mutually exclusive and a single muscle often performs a range of mechanically diverse tasks. This functional diversity has obscured the relationship between a muscle's locomotor function and its mechanical properties. I use hopping in toads as a model system for comparing muscles that primarily produce mechanical energy with muscles that primarily dissipate mechanical energy. During hopping, hindlimb muscles undergo active shortening to produce mechanical energy and propel the animal into the air, whereas the forelimb muscles undergo active lengthening to dissipate mechanical energy during landing. Muscles performing distinct mechanical functions operate on different regions of the force-length curve. These findings suggest that a muscle's operating length may be shaped by potential trade-offs between force production and sarcomere stability. In addition, the passive force-length properties of hindlimb and forelimb muscles vary, suggesting that passive stiffness functions to restrict the muscle's operating length in vivo. These results inform our understanding of vertebrate muscle variation by providing a clear link between a muscle's locomotor function and its mechanical properties.

Keywords: force–length; hopping; landing; length–tension; muscle stiffness; passive elasticity.


Figures

Figure 1.
Figure 1.
Time-lapse sequence of a hopping bout in Rhinella marinus. This image highlights the role of hindlimbs in accelerating the body into the air and forelimbs in decelerating the body during landing. Images are taken from a high-speed video sequence recorded at 400 frames per second.
Figure 2.
Figure 2.
(a) The two muscles used in this study are the anconeus muscle, a primary elbow extensor, and the plantaris muscle, a primary ankle extensor. (b) Each muscle was instrumented with a pair of sonomicrometry transducers, which measured fascicle lengths, and two electromyography electrodes, which measured muscle activity patterns during hopping. The schematic of the muscle is representative of the anconeus muscle. (Online version in colour.)
Figure 3.
Figure 3.
Fascicle lengths and muscle activity patterns during hopping. (a) The plantaris muscle functions as a motor by shortening actively during the take-off phase of a hop. (b) The anconeus muscle shortens actively during the aerial phase in anticipation of landing but functions as a brake by being actively stretched after impact. The shaded areas indicate the regions of muscle fascicle behaviour that are mapped onto the force–length curve.
Figure 4.
Figure 4.
Passive and active force–length curves for the (a) plantaris and (b) anconeus muscles. The same muscles with the same sonomicrometry transducers used for in vivo measurements are used to characterize the force–length curve in vitro. Data are normalized relative to the muscles maximum isometric force (Po) and the muscle's optimal length (Lo) and fit according to [21]. Each individual is shown with a different symbol.
Figure 5.
Figure 5.
A comparison of the passive properties of the plantaris and anconeus. (a) The passive force–length curves of the two muscles plotted with 95% confidence intervals of the curve (dotted). (b) Log-transformed passive forces. Log transformation converts data from an exponential curve to linear and allows for more direct statistical comparisons using an ANCOVA. Data from the two muscles differ significantly in their slope, suggesting that the two muscles vary in their stiffness (p = 0.0001). (c) A comparison of the lengths at which passive force develops in the two muscles. L20 represents the lengths at which passive force reaches 20% of maximum isomeric force (Po). L20 is significantly longer in the plantaris when compared with the anconeus muscle (p < 0.0001).
Figure 6.
Figure 6.
The operating lengths of the (a) plantaris and (b) anconeus muscle. The operating length of each muscle is plotted onto the force–length curve. Each individual is shown as a single bar with the initial and final lengths defining the two ends of the bar. Each bar is shown alongside the standard error of the mean. For the plantaris, the muscle starts at a long length and shortens to the plateau. However, for the anconeus the muscle starts at a short length and lengthens on to the plateau of the force–length curve. Note that the bars only indicate the length range during hopping and do not correspond to the force axis. (c) The maximum operating length of the two muscles differs significantly (p = 0.003). The anconeus muscle is restricted to the ascending limb and plateau of the force–length curve, rarely operating at lengths above Lo.

References

    1. Dickinson MH, Farley CT, Full RJ, Koehl MAR, Kram R, Lehman S. 2000. How animals move: an integrative view. Science 288, 100–106 (doi:10.1126/science.288.5463.100) - DOI - PubMed
    1. Daley MA, Biewener AA. 2003. Muscle force–length dynamics during level versus incline locomotion: a comparison of in vivo performance of two guinea fowl ankle extensors. J. Exp. Biol. 206, 2941–2958 (doi:10.1242/jeb.00503) - DOI - PubMed
    1. Ahn AN, Meijer K, Full RJ. 2006. In situ muscle power differs without varying in vitro mechanical properties in two insect leg muscles innervated by the same motor neuron. J. Exp. Biol. 209, 3370–3382 (doi:10.1242/jeb.02392) - DOI - PubMed
    1. Swoap SJ, Johnson TP, Josephson RK, Bennett AF. 1993. Temperature, muscle power output and limitations on burst locomotor performance of the lizard Dipsosaurus dorsalis. J. Exp. Biol. 174, 185–197
    1. George NT, Sponberg S, Daniel TL. 2012. Temperature gradients drive mechanical energy gradients in the flight muscle of Manduca sexta. J. Exp. Biol. 215, 471–479 (doi:10.1242/jeb.062901) - DOI - PubMed

Publication types