. 2014 Apr 9;281(1783):20133350.
doi: 10.1098/rspb.2013.3350. Print 2014 May 22.

Marine biological shifts and climate

Affiliations

Marine biological shifts and climate

Grégory Beaugrand et al. Proc Biol Sci. .

Abstract

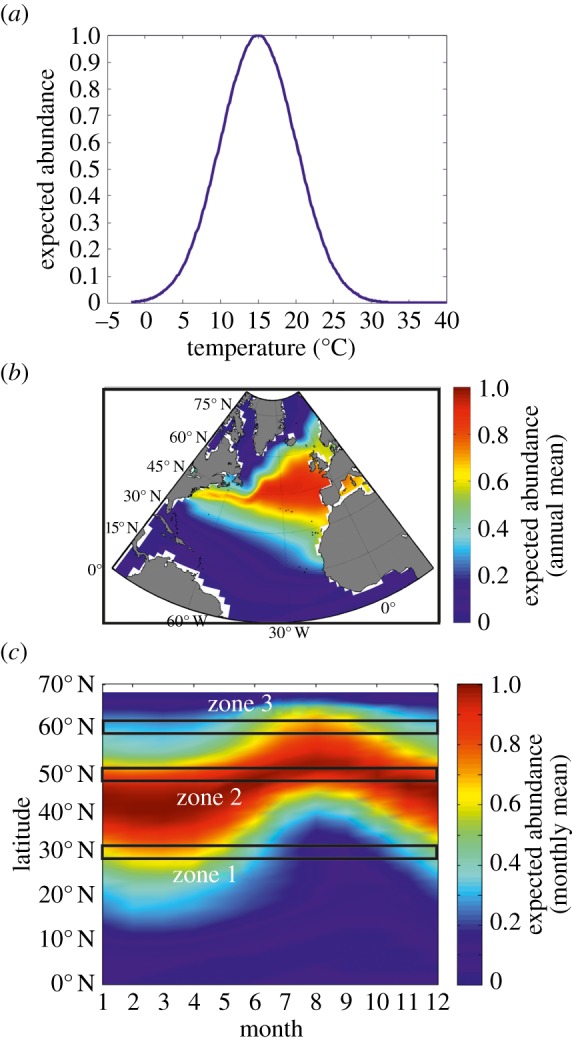
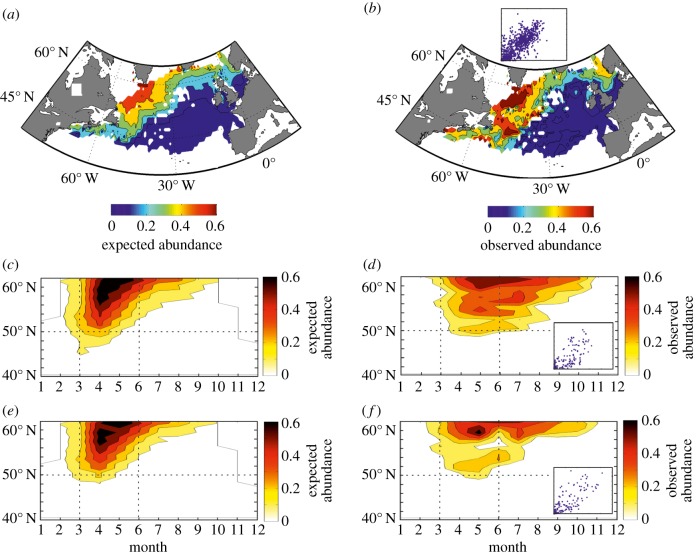
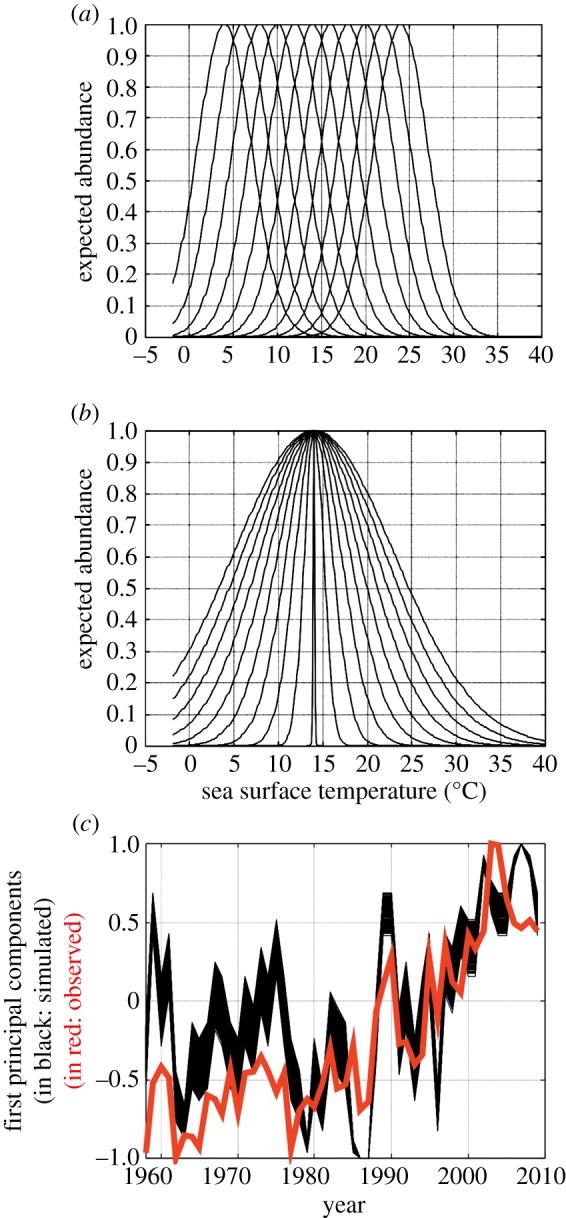
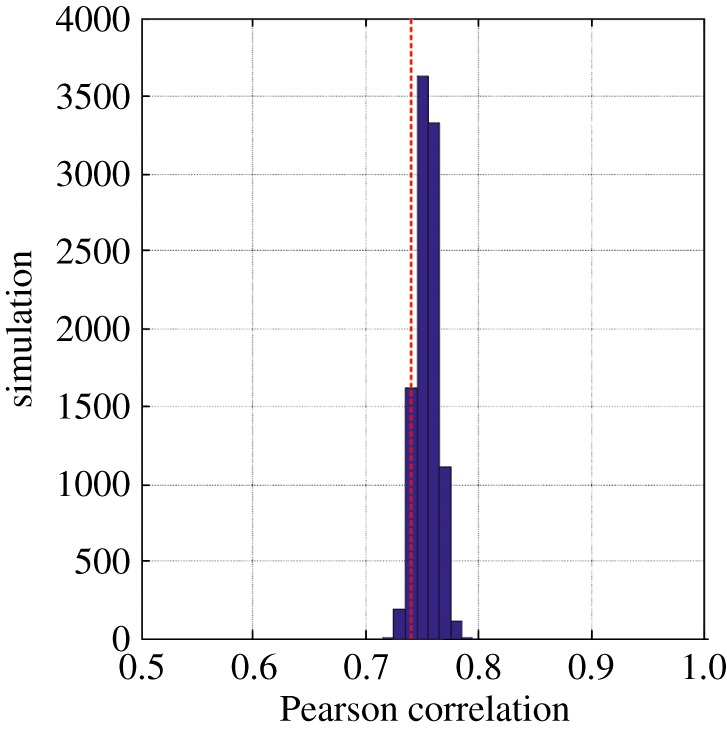
Phenological, biogeographic and community shifts are among the reported responses of marine ecosystems and their species to climate change. However, despite both the profound consequences for ecosystem functioning and services, our understanding of the root causes underlying these biological changes remains rudimentary. Here, we show that a significant proportion of the responses of species and communities to climate change are deterministic at some emergent spatio-temporal scales, enabling testable predictions and more accurate projections of future changes. We propose a theory based on the concept of the ecological niche to connect phenological, biogeographic and long-term community shifts. The theory explains approximately 70% of the phenological and biogeographic shifts of a key zooplankton Calanus finmarchicus in the North Atlantic and approximately 56% of the long-term shifts in copepods observed in the North Sea during the period 1958-2009.

Keywords: climate change; marine; shifts.


Figures

Figure 1.
Figure 1.
Theoretical relationships between the species distribution, the latitudinal range and the phenology of an eurytherm temperate species calculated from the application of our theory. (a) Theoretical thermal niche. (b) Theoretical mean annual spatial distribution. (c) Theoretical changes in abundance as a function of latitudes and month. Zone 1 is the part of the species distribution where the seasonal maximum occurs in spring or winter. Zone 2 is the part of the species distribution where the seasonal extent is highest. Zone 3 is the part of the species distribution where the seasonal maximum is located at the end of summer.
Figure 2.
Figure 2.
Relationships between the spatial distribution, the latitudinal ranges and the phenological shifts of both observed and theoretical abundance of C. finmarchicus from the application of our theory. The NPPEN model was used to calculate the expected abundance of C. finmarchicus (electronic supplementary material). (a) Expected and (b) observed spatial distribution of C. finmarchicus in the North Atlantic. Latitudinal and seasonal changes in both the expected and observed abundance of C. finmarchicus based on the periods 1960–1979 (c and d, respectively) and 1990–2009 (e and f, respectively). Both expected and observed abundance of C. finmarchicus were calculated for a meridional band between 30° W and 10° W (northeast Atlantic). Scaled between 0 and 1, scatterplots in (b), (d) and (f) exhibit expected abundance versus observed abundance for (ab), (cd) and (ef), respectively. Both vertical and horizontal dashed lines (cf) are superimposed to better reveal phenological and biogeographic shifts.
Figure 3.
Figure 3.
The community shift in the North Sea (4° W–10° E; 51° N–60° N) reconstructed from the application of our theory. Examples of some simulated niches based on (a) different thermal optimums us, and a constant thermal tolerance ts, and (b) a constant average us and different thermal tolerances ts (electronic supplementary material). Only pseudospecies that could establish in the North Sea were used in the analyses. (c) First principal components (10 000 first principal components; in black) from standardized PCAs applied on each simulated table 52 years × 27 pseudospecies and the first principal component (in red) from a standardized PCA performed on the table 52 years × 27 copepods.
Figure 4.
Figure 4.
Frequency distribution of the Pearson correlation coefficient calculated between each first principal component calculated for each simulated table 52 years × 27 pseudospecies and the first principal component performed on the table 52 years × 27 copepods (electronic supplementary material). The red dashed vertical line indicates the correlation between observed annual ecosystem changes and changes in annual SST.

References

    1. Edwards M, Richardson AJ. 2004. Impact of climate change on marine pelagic phenology and trophic mismatch. Nature 430, 881–884 (doi:10.1038/nature02808) - DOI - PubMed
    1. Beaugrand G, Reid PC, Ibañez F, Lindley JA, Edwards M. 2002. Reorganisation of North Atlantic marine copepod biodiversity and climate. Science 296, 1692–1694 (doi:10.1126/science.1071329) - DOI - PubMed
    1. Parmesan C, Yohe G. 2003. A globally coherent fingerprint of climate change impacts across natural systems. Nature 421, 37–42 (doi:10.1038/nature01286) - DOI - PubMed
    1. de Young B, Barange M, Beaugrand G, Harris R, Perry RI, Scheffer M. 2008. Regime shifts in marine ecosystems: detection, prediction and management. Trends Ecol. Evol. 23, 402–409 (doi:10.1016/j.tree.2008.03.008) - DOI - PubMed
    1. Beaugrand G, Edwards M, Brander K, Luczak C, Ibañez F. 2008. Causes and projections of abrupt climate-driven ecosystem shifts in the North Atlantic. Ecol. Lett. 11, 1157–1168 - PubMed

Publication types

LinkOut - more resources