. 2014 Apr 9;6(231):231ra49.
doi: 10.1126/scitranslmed.3007579.

Immunological visibility: posttranscriptional regulation of human NKG2D ligands by the EGF receptor pathway

Affiliations

Immunological visibility: posttranscriptional regulation of human NKG2D ligands by the EGF receptor pathway

Pierre Vantourout et al. Sci Transl Med. .

Abstract

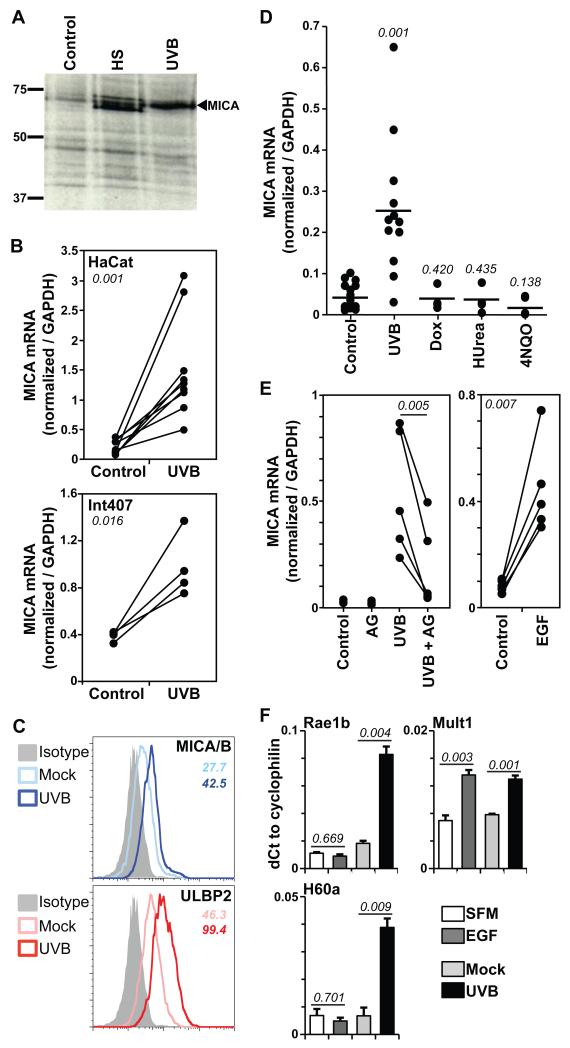
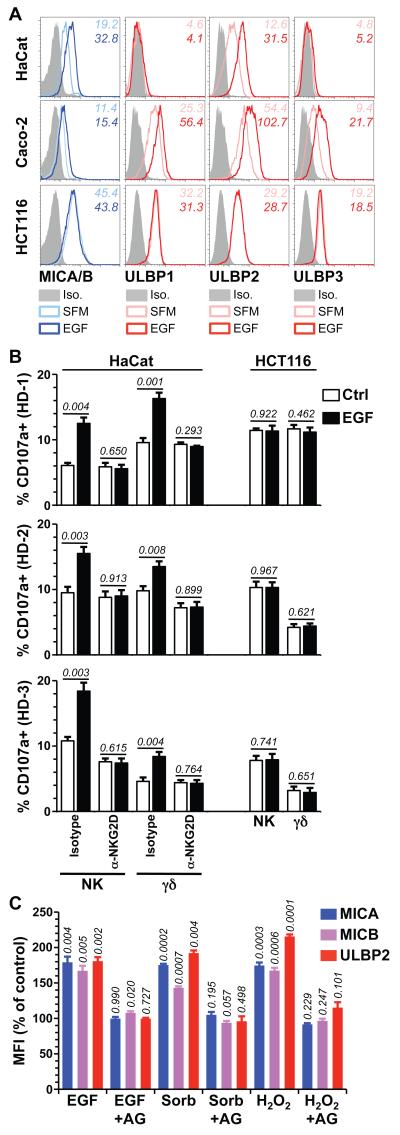
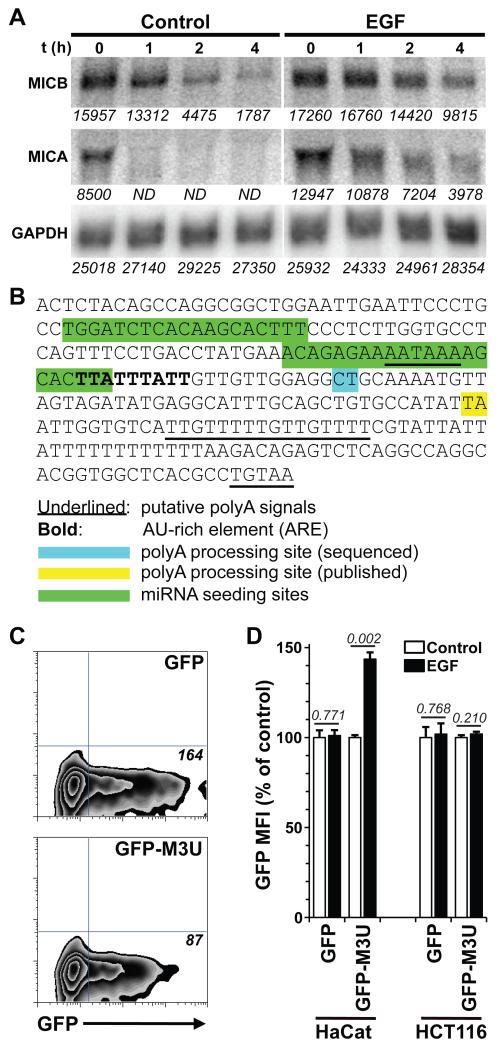
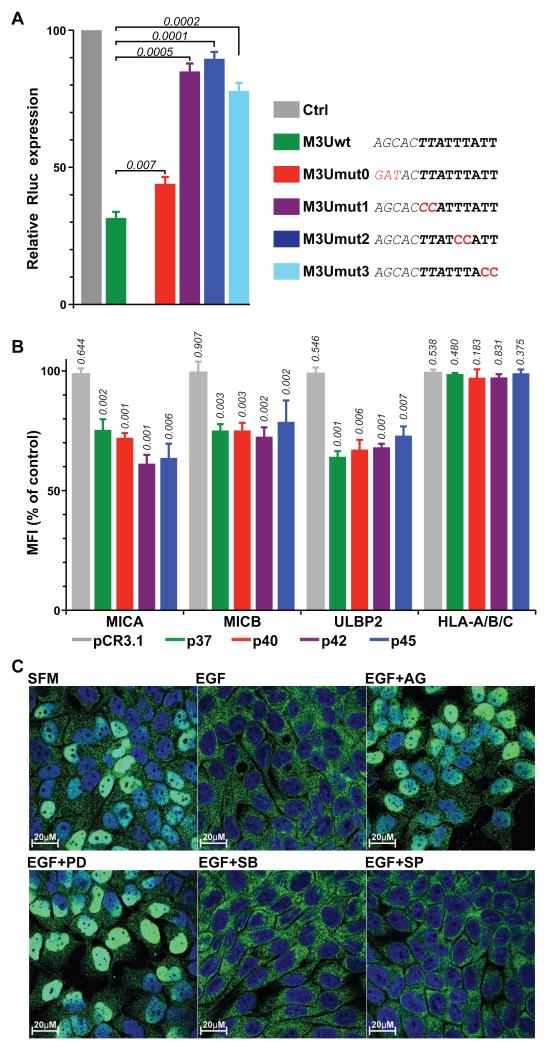
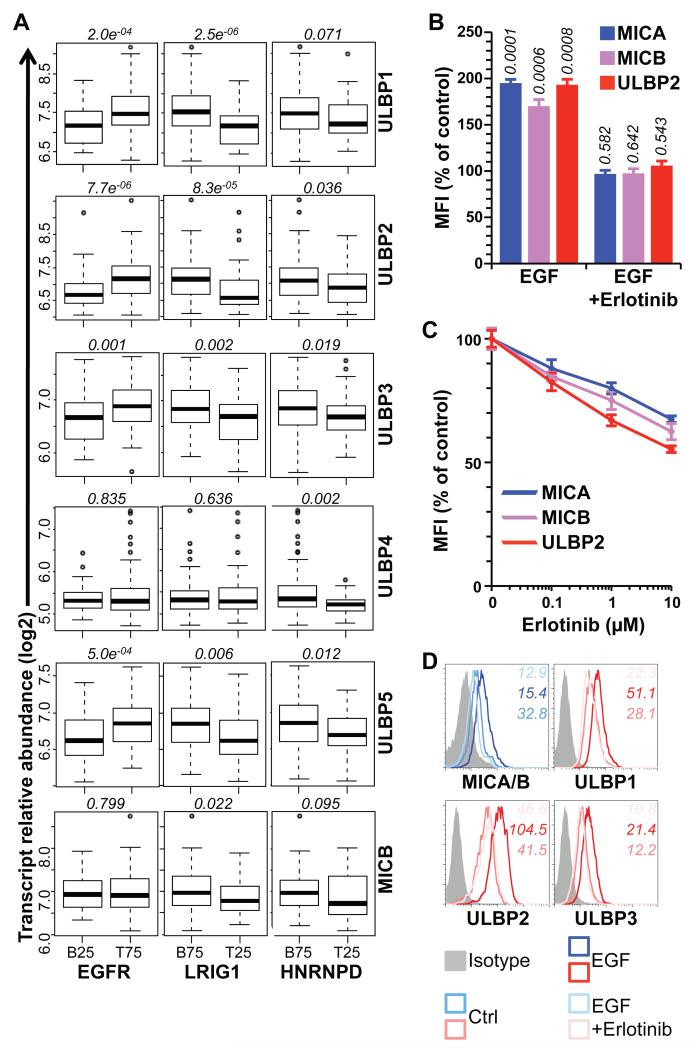
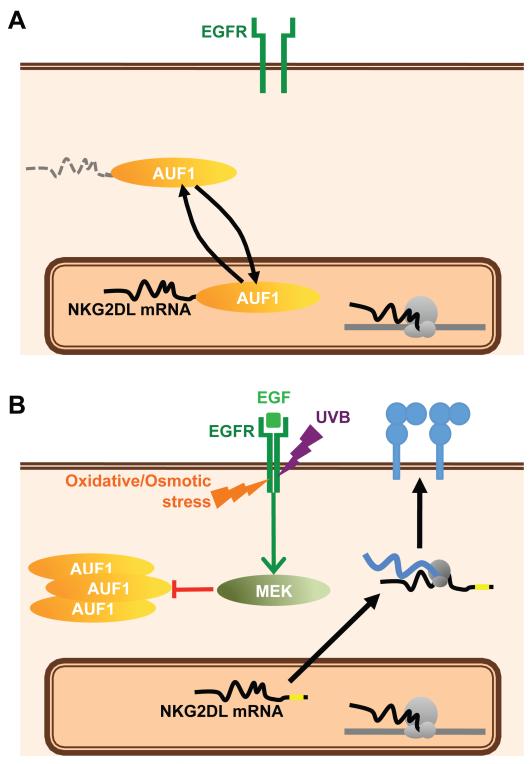
Human cytolytic T lymphocytes and natural killer cells can limit tumor growth and are being increasingly harnessed for tumor immunotherapy. One way cytolytic lymphocytes recognize tumor cells is by engagement of their activating receptor, NKG2D, by stress antigens of the MICA/B and ULBP families. This study shows that surface up-regulation of NKG2D ligands by human epithelial cells in response to ultraviolet irradiation, osmotic shock, oxidative stress, and growth factor provision is attributable to activation of the epidermal growth factor receptor (EGFR). EGFR activation causes intracellular relocalization of AUF1 proteins that ordinarily destabilize NKG2D ligand mRNAs by targeting an AU-rich element conserved within the 3' ends of most human, but not murine, NKG2D ligand genes. Consistent with these findings, NKG2D ligand expression by primary human carcinomas positively correlated with EGFR expression, which is commonly hyperactivated in such tumors, and was reduced by clinical EGFR inhibitors. Therefore, stress-induced activation of EGFR not only regulates cell growth but also concomitantly regulates the cells' immunological visibility. Thus, therapeutics designed to limit cancer cell growth should also be considered in terms of their impact on immunosurveillance.


Figures

Figure 1
Figure 1. UVB upregulates NKG2D ligand expression via EGFR
(A) Confluent HaCat cells were untreated (control) or exposed to UVB (60mJ/cm2) or heat shock (HS, 90mins 42°C), labelled with 35S-methionine/cysteine immediately after HS and 24h post-UVB, and lysed. MICA immunoprecipitates were analysed relative to known size markers (kD) by SDS-PAGE and autoradiography. (B) Confluent HaCat (top) or Int407 (bottom) cells were untreated or exposed to UVB. RNA was extracted 24h later and MICA quantified relative to GAPDH by real-time qPCR. Data were compiled from 9 (HaCat) and 4 (Int407) independent experiments. Numbers in italic indicate p values (paired t-test). (C) Primary human keratinocytes were untreated (Mock) or UVB-irradiated (60mJ/cm2) and MICA/B and ULBP2 expression monitored by flow cytometry 24h post-treatment. Numbers in italic indicate respective MFI values. (D) Confluent HaCat cells were exposed to UVB or treated with doxorubicin (Dox, 1μg/mL), hydroxyurea (HUrea, 1mM) or 4NQO (1μg/mL). MICA expression was monitored as in B. Each dot represents the analysis of an individual sample. Numbers in italic indicate p values relative to control (unpaired t-test). (E) Confluent HaCat cells were untreated (control) or treated with the EGFR inhibitor AG1478 (AG) alone or 30mins prior to UVB irradiation (left); or serum-deprived overnight and incubated +/− EGF (500ng/mL, right), and mRNA levels quantified as in B. Results from 5 independent experiments are shown. Numbers in italic indicate p values (paired t-test). (F) Confluent primary murine keratinocytes in serum free medium (SFM) were untreated or stimulated with EGF (100ng/mL) for 24h (left). As a positive control for Rae1b and H60a upregulation, cells were UVB irradiated (right). Expression was monitored by real-time qPCR. Data were normalized to cyclophilin and expressed as the mean of three treatments +/− SD. Numbers in italic indicate p values (unpaired t-test).
Figure 2
Figure 2. Cell surface expression of NKG2D ligands is upregulated by EGF and cellular stresses
(A) Confluent HaCat, Caco-2 and HCT116 cells were serum-deprived overnight and stimulated with 500 ng/mL EGF (dark blue and red histograms) or left in serum-free medium (SFM) (light blue and red histograms) for 24h and cell surface expression of the indicated NKG2D ligands monitored by flow cytometry. Data are representative of at least 3 independent experiments (iso = isotype control staining). (B) HaCat and HCT116 cells were treated as in A (see Figure S2D for assesement of NKG2D ligand expression) and then co-incubated for 5h at 37°C with PBMCfrom 3 healthy donors (HD1-3) in the presence of PE-conjugated anti-CD107a antibody and a blocking anti-NKG2D or isotype control antibody (10μg/mL). Cells were washed and stained with APC-anti-CD3 and FITC-anti-pan TCRγδ, or with APC anti-CD3 and FITC anti-CD56 to analyse responses of γδ T and NK cells, respectively (see Figure S3 for gating controls). Data are means of triplicate stimulations +/− SD. Numbers in italic indicate p values (unpaired t-test). (C) HaCat cells serum-deprived overnight were treated with EGF (500ng/mL), Sorbitol (Sorb, 0.5M) or hydrogen peroxide (H2O2, 0.6mM) with or without a 1h pre-treatment with AG1478 (AG, 10μM). Surface MICA, MICB and ULBP2 expression levels were monitored 24h later by FACS. Data normalized to untreated cells (ctrl) and expressed as means of three treatments +/− SD. Numbers in italics are p values (unpaired t-test).
Figure 3
Figure 3. MICA mRNA stability is regulated by its 3′UTR
(A) HaCat cells were serum-deprived and incubated overnight with or without EGF (500ng/mL). Actinomycin D was added and RNA extracted at the indicated time points [t (h)] for northern analysis. The blot was probed for MICA and MICB, and re-probed for GAPDH. Representative of 3 experiments. Densitometry analysis was performed with ImageJ and raw values are indicated in italics for each sample (ND, not detectable). See Figure S5A for the evaluation of mRNA half-lives (B) The sequence of the full 3′UTR of MICA was deduced from cloning and sequencing and from the genomic sequence (accession number NC_000006.11) to include poly-A signals (underlined), relative to which the poly-A processing site identified by re-sequencing (blue) shows a different location than the previously identified site (yellow) (see also Figure S6A). Also shown are microRNA seeding sites (green) and a canonical ARE (bold). (C) HaCat cells were transfected with the pMax-FP-Green plasmid (GFP) or a modified version including the 3′UTR of MICA (GFP-M3U). GFP expression was monitored by flow cytometry 24h post-transfection. Plots are representative of 3 independent transfections. Numbers in italic indicate MFI. (D) HaCat and HCT116 cells were transfected as in B. Medium was supplemented 24h post-transfection with G418 (0.5mg/mL). After 14 days, confluent cells were serum-deprived overnight and further treated (or not) with EGF for 24h before GFP expression was analyzed by flow cytometry. Data were normalized to untreated cells for each transfectant and are means of triplicate EGF treatments +/− SD. Numbers in italic indicate p values (unpaired t-test).
Figure 4
Figure 4. The ARE and AUF1 destabilize MICA mRNA
(A) HaCat cells were transfected with plasmids encoding Renilla luciferase (Rluc, pGL4.74, Ctrl) or modified versions including the wild-type (wt) or mutated (M3Umut0 to M3Umut3) 3′UTR of MICA and co-transfected with a plasmid encoding Firefly luciferase (Fluc) as an internal control. At 24h post-transfection, luciferase activity was measured using a Dual-Luciferase reporter assay system, and luminescence values for Rluc normalized to the internal Fluc values and to the wt Rluc control. Data are the mean of three independent transfections +/− SD. Numbers in italic indicate p values (unpaired t-test). Relevant sequences are indicated, including the miRNA seeding site (italic), ARE (bold) and mutations generated (red). (B) HaCat cells were mock-transfected, or transfected with pCR3.1 plasmids either empty or encoding each AUF1 isoform as indicated. Cell-surface expression of MICA, MICB and ULBP2 was analyzed by flow cytometry at 36h post-transfection. Data are normalized to mock-transfected cells expressed as the mean of three transfections +/− SD. Numbers in italic indicate p values (unpaired t-test). (C) HaCat cells grown on coverslips were treated as indicated, fixed and permeabilized, stained for endogenous AUF1, and analysed by confocal microscopy. Images are representative of 3 independent experiments and show overlays of AUF1 (green) and DAPI staining (blue) (see Figure S9B for individual channels).
Figure 5
Figure 5. The EGFR-mediated upregulation of NKG2D ligand upregulation has clinical implications
(A) Expression of NKG2D ligands in primary breast cancers with the bottom 25% (B25) EGFR or top 25% (T25) LRIG1 and HNRNPD gene expression compared to the remaining samples. Numbers in italic indicate p values (Wilcoxon rank sum test). (B) HaCat cells were grown to confluence, serum-deprived for 24h, treated or not with EGF (500ng/mL) for 24h with or without a 1h pre-treatment with Erlotinib (10μM), and stained for MICA, MICB and ULBP2. Data normalized to untreated cells (control) and expressed as the mean of three treatments +/− SD. Numbers in italic indicate p values (unpaired t-test). (C) Actively growing subconfluent HaCat cells grown in complete medium were treated or not with increasing doses of Erlotinib for 24h and stained for MICA, MICB and ULBP2. Data were normalized to untreated cells and are means of three treatments +/− SD. (D) Differentiated Caco-2 monolayers grown on collagen-coated transwell inserts until establishing electrically-resistant epithelial sheets were serum-deprived overnight, treated (or not) with EGF (500ng/mL) for 24h with or without a 1h pre-treatment with Erlotinib (10μM), and stained for MICA/B and ULBP2. Numbers in italic indicate MFI.
Figure 6
Figure 6. The EGFR pathway induces NKG2D ligand upregulation via the abrogation of AUF1-mediated mRNA destabilization
(A) Under normal conditions, NKG2D ligand mRNAs are constitutively targeted by AUF1 for degradation via their AU-Rich Elements. (B) Activation of the EGFR, either by its ligand or by any of several physico-chemical stresses leads activates the MEK pathway and the exclusion of AUF1 from the nucleus, allowing NKG2D ligand mRNAs to be stabilized and translated and the proteins to be expressed at the cell surface, where they may engage NKG2D on cytolytic lymphocytes.

References

    1. Wild CP. Complementing the genome with an “exposome”: the outstanding challenge of environmental exposure measurement in molecular epidemiology. Cancer Epidemiol Biomarkers Prev. 2005;14:1847–1850. - PubMed
    1. Hayday AC. Gammadelta T cells and the lymphoid stress-surveillance response. Immunity. 2009;31:184–196. - PubMed
    1. Nedellec S, Sabourin C, Bonneville M, Scotet E. NKG2D costimulates human V gamma 9V delta 2 T cell antitumor cytotoxicity through protein kinase C theta-dependent modulation of early TCR-induced calcium and transduction signals. J Immunol. 2010;185:55–63. - PubMed
    1. Rincon-Orozco B, et al. Activation of V gamma 9V delta 2 T cells by NKG2D. J Immunol. 2005;175:2144–2151. - PubMed
    1. Shafi S, et al. An NKG2D-mediated human lymphoid stress surveillance response with high interindividual variation. Sci Transl Med. 2011;3:113ra124. - PMC - PubMed

Publication types

MeSH terms