. 2014 May;141(9):1814-20.
doi: 10.1242/dev.107045. Epub 2014 Apr 9.

Recapitulation of morphogenetic cell shape changes enables wound re-epithelialisation

Affiliations

Recapitulation of morphogenetic cell shape changes enables wound re-epithelialisation

William Razzell et al. Development. 2014 May.

Abstract

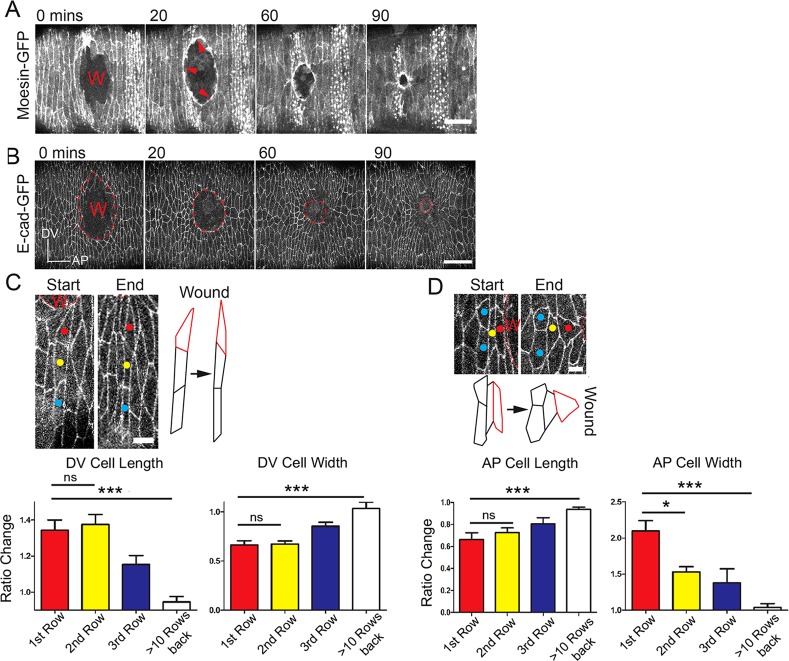
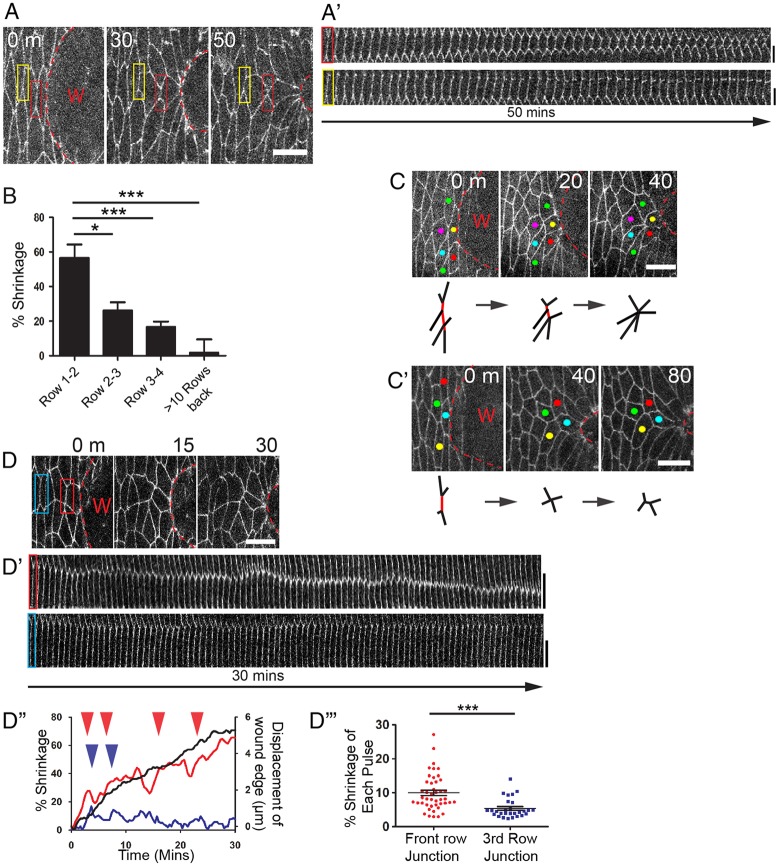
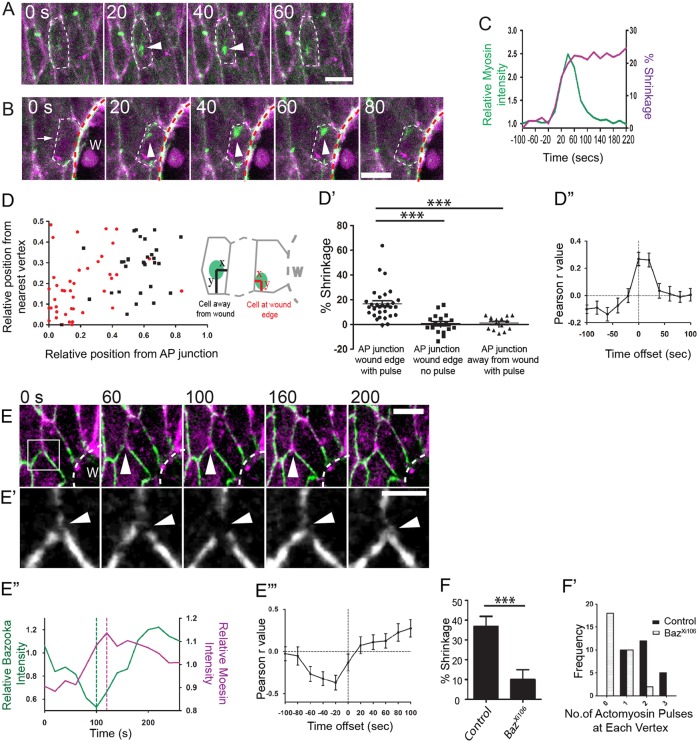
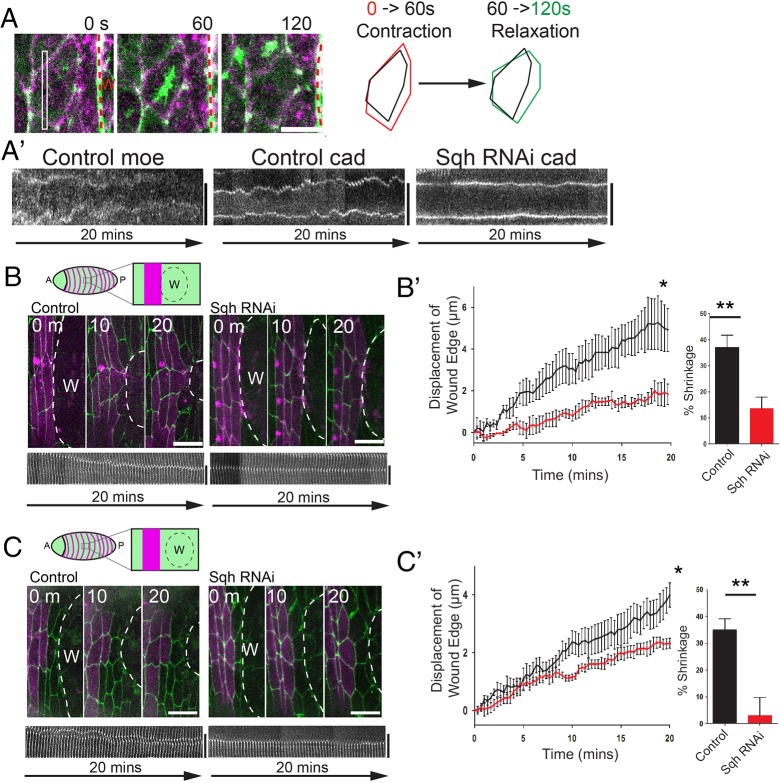
Wound repair is a fundamental, conserved mechanism for maintaining tissue homeostasis and shares many parallels with embryonic morphogenesis. Small wounds in simple epithelia rapidly assemble a contractile actomyosin cable at their leading edge, as well as dynamic filopodia that finally knit the wound edges together. Most studies of wound re-epithelialisation have focused on the actin machineries that assemble in the leading edge of front row cells and that resemble the contractile mechanisms that drive morphogenetic episodes, including Drosophila dorsal closure, but, clearly, multiple cell rows back must also contribute for efficient repair of the wound. Here, we examine the role of cells back from the wound edge and show that they also stretch towards the wound and cells anterior-posterior to the wound edge rearrange their junctions with neighbours to drive cell intercalation events. This process in anterior-posterior cells is active and dependent on pulses of actomyosin that lead to ratcheted shrinkage of junctions; the actomyosin pulses are targeted to breaks in the cell polarity protein Par3 at cell vertices. Inhibiting actomyosin dynamics back from the leading edge prevents junction shrinkage and inhibits the wound edge from advancing. These events recapitulate cell rearrangements that occur during germband extension, in which intercalation events drive the elongation of tissues.

Keywords: Actomyosin behaviour; Drosophila embryo; Wound healing.


Figures

Fig. 1.
Fig. 1.
Multiple cell rows stretch towards the closing wound. (A) A time course series of wound closure in a Moesin-GFP-expressing embryo illustrating the actomyosin ‘purse-string’ (red arrows). (B) An equivalent E-cadherin-GFP wounded embryo showing cell shape changes at the wound edge. Axis inset shows dorsal-ventral (DV) and anterior-posterior (AP) orientation. (C) High magnification views of start and end images from a wounded E-cadherin-GFP embryo and accompanying schematics to highlight cell shape changes of DV cells (C) versus AP cells (D). Cells at the immediate wound margin outlined in red. Graphs represent relative length and width of cells at the end versus start of wounding (n≥12 cells for each row from three wounds). Wounds (W) marked by the dashed lines. Error bars represent s.e.m. Scale bars: 20 µm (A); 25 µm (B); 5 µm (C,D). Time is in minutes. ns, not significant, *P<0.05, ***P<0.001, one-way ANOVA with Bonferroni's post-hoc test.
Fig. 2.
Fig. 2.
AP cells exhibit ratchet-like junction shrinking and cell intercalation events. (A) Time-lapse (still) images from a wounded E-cadherin-GFP embryo showing a junction between two AP cells (red box) shrinking as the wound closes. (A′) Kymograph analysis of the junctions highlighted by the red and yellow boxes in A shows junctions shrinking over time. (B) Graph illustrating percentage junction shrinkage over 60 min versus junctional distance back from the wound edge (n≥17 junctions from six wounds for each row). (C,C′) Example of the shrinking of multiple adjacent junctions to form a multicellular rosette (C) and shrinking of a junction leading to an intercalation event (C′). Schematics beneath indicate shrinking junctions in red. (D,D′) A time-lapse series of (still) images of AP cells (D) used for kymograph analysis (D′) of the junctions highlighted by the red and blue boxes in D. (D′′) Plot of wound edge advancement (black) and percentage junction shrinking between wound edge cells (red) and far back from the wound edge (blue) as highlighted in D. (Arrowheads indicate pulses of shrinking.) (D′′′) Plot showing contraction pulses in cells positioned various distances from the wound edge (n≥14 junctions from six wounds for each). Wounds (W) highlighted by the dashed lines in all. Error bars represent s.e.m. Scale bars: 10 µm (A,C,C′,D); 5 µm (A′,D′). Time is in minutes. *P<0.05,***P<0.001, one-way ANOVA with Bonferroni's post-hoc test (B) or Student's t-test (D′′′).
Fig. 3.
Fig. 3.
Junctional shrinking pulses correlate with myosin flashes near the junction. (A,B) Time-lapse still images showing myosin (green, arrowheads) coalescing at the apex of a cell in the unwounded epithelium (A) and at the vertex of a wound edge cell (arrowheads) of an AP junction (arrow) (B). Dashed lines indicate cell outlines. (C) Plot of relative myosin intensity (green) versus percentage shrinking of the AP junction (magenta) over time. (D) Plot of the location of myosin pulses (indicated by green in schematics) in cells at wound edge (red) versus at least three rows away from the wound (black) (n≥25 pulses from 21 cells from eight different wounds for each cell type). (D′) Plot of percentage AP junction shrinkage after each pulse of myosin (n≥18 pulses from 15 cells in ten wounds for each). (D′′) Pearson correlation for the change in myosin intensity around the shrinking AP junctions versus change in junction length. r values were calculated by shifting the myosin data set in time (n=22 junctions from ten wounds). (E) Time-lapse (still) images from a wound edge cell as Bazooka-GFP (green) is lost from the cell vertex (arrowheads) of the AP junction, immediately prior to an actin pulse (magenta). (E′) High magnification view of the region highlighted in E of the Bazooka-GFP channel only, showing a break and re-sealing of Bazooka (arrowheads). (E′′) Plot of the relative Bazooka-GFP intensity (green) and relative Moesin intensity at the break point in E. Dashed lines indicate where loss of Bazooka precedes an actin pulse. (E′′′) Pearson correlation of Bazooka-GFP intensity versus mCherry-Moesin intensity at cell vertices. r values were generated by shifting the Moesin data set in time (n=24 vertices from six wounds). (F) Percentage junction shrinkage over 30 min of wound closure in control versus BazXi106 mutant embryos (n≥22 junctions from five wounds for each). (F′) Frequency distribution of actin pulses in control versus BazXi106 mutant embryos (n≥27 vertices from six wounds for each). Wounds (W) all marked by dashed white lines. Scale bars: 5 µm (A,B,E); 2 µm (E′). Error bars represent s.e.m. ***P<0.001, one-way ANOVA with Bonferroni's post-hoc test (D′) or Student's t-test (F). Time is in seconds.
Fig. 4.
Fig. 4.
Inhibiting myosin pulses prevents junction shrinkage and wound edge advancement. (A) Time-lapse (still) images from a movie showing a myosin (green) pulse as it drives contraction and then relaxation (see schematic) of a wound edge cell. (A′) Kymograph analysis of cell areas showing apical area fluctuations in control cells from A (Control moe, Control cad), but no fluctuations when these cells express Spaghetti-squash RNAi (Sqh RNAi cad). (B,C) Wounds made immediately adjacent to control or Sqh RNAi-expressing engrailed cells (B) or with one row of wild-type cells between the wound and engrailed stripes (either control or expressing Sqh RNAi; C) (see schematics) in E-cadherin-GFP embryos with engrailed stripes labelled with mCherry-Moesin (magenta). Kymograph analysis shows junction dynamics in control and Sqh RNAi-expressing cells for junctions between the first and second row cells. (B′,C′) Plots of epithelial advancement over time in wounds made immediately adjacent to (B′) or with one row of wild-type cells in front of (C′) control and Sqh RNAi-expressing cells (n=3 wounds for each in B′ and n=7 in C′). Bar graphs show percentage shrinking of junctions between front and second row cells after 20 min of wound closure (n≥7 junctions from three wounds in B′ and n ≥7 junctions from seven wounds in C′). Error bars represent s.e.m. Time is in seconds (A) or minutes (B,C). Scale bars: 5 µm (A); 10 µm (B,C). *P<0.05, two-way ANOVA with Bonferroni's post-hoc test; **P<0.01, Student's t-test.

References

    1. Antunes M., Pereira T., Cordeiro J. V., Almeida L., Jacinto A. (2013). Coordinated waves of actomyosin flow and apical cell constriction immediately after wounding. J. Cell Biol. 202, 365-379 10.1083/jcb.201211039 - DOI - PMC - PubMed
    1. Bertet C., Sulak L., Lecuit T. (2004). Myosin-dependent junction remodelling controls planar cell intercalation and axis elongation. Nature 429, 667-671 10.1038/nature02590 - DOI - PubMed
    1. Blankenship J. T., Backovic S. T., Sanny J. S. P., Weitz O., Zallen J. A. (2006). Multicellular rosette formation links planar cell polarity to tissue morphogenesis. Dev. Cell 11, 459-470 10.1016/j.devcel.2006.09.007 - DOI - PubMed
    1. Brock J., Midwinter K., Lewis J., Martin P. (1996). Healing of incisional wounds in the embryonic chick wing bud: characterization of the actin purse-string and demonstration of a requirement for Rho activation. J. Cell Biol. 135, 1097-1107 10.1083/jcb.135.4.1097 - DOI - PMC - PubMed
    1. Bulgakova N. A., Grigoriev I., Yap A. S., Akhmanova A., Brown N. H. (2013). Dynamic microtubules produce an asymmetric E-cadherin-Bazooka complex to maintain segment boundaries. J. Cell Biol. 201, 887-901 10.1083/jcb.201211159 - DOI - PMC - PubMed

Publication types

LinkOut - more resources