. 2014 Apr 9;34(15):5184-99.
doi: 10.1523/JNEUROSCI.4129-13.2014.

Ezh2 regulates adult hippocampal neurogenesis and memory

Affiliations

Ezh2 regulates adult hippocampal neurogenesis and memory

Juan Zhang et al. J Neurosci. .

Abstract

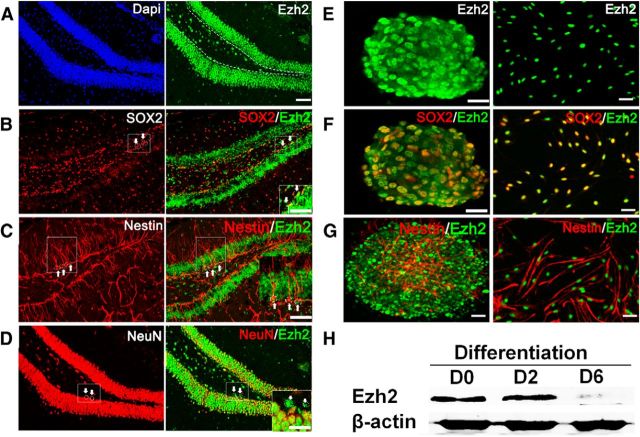
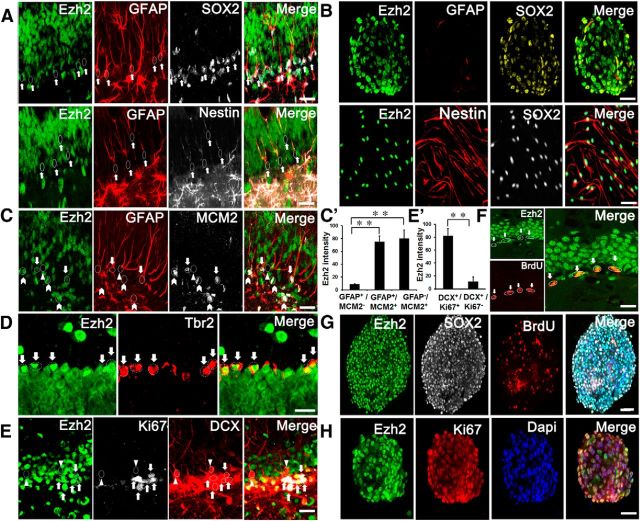
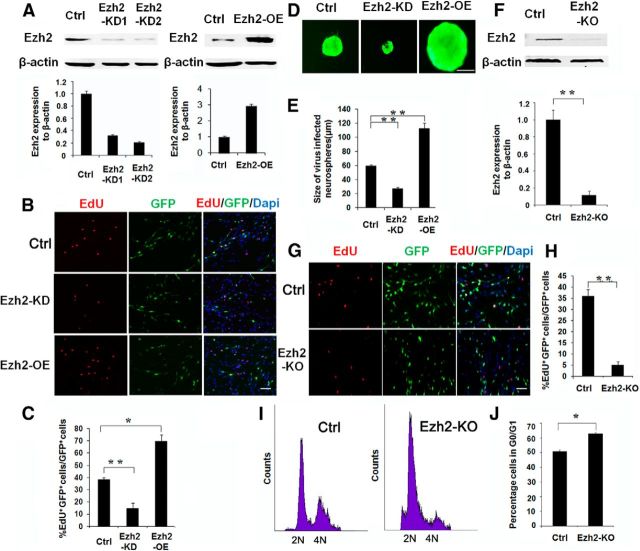
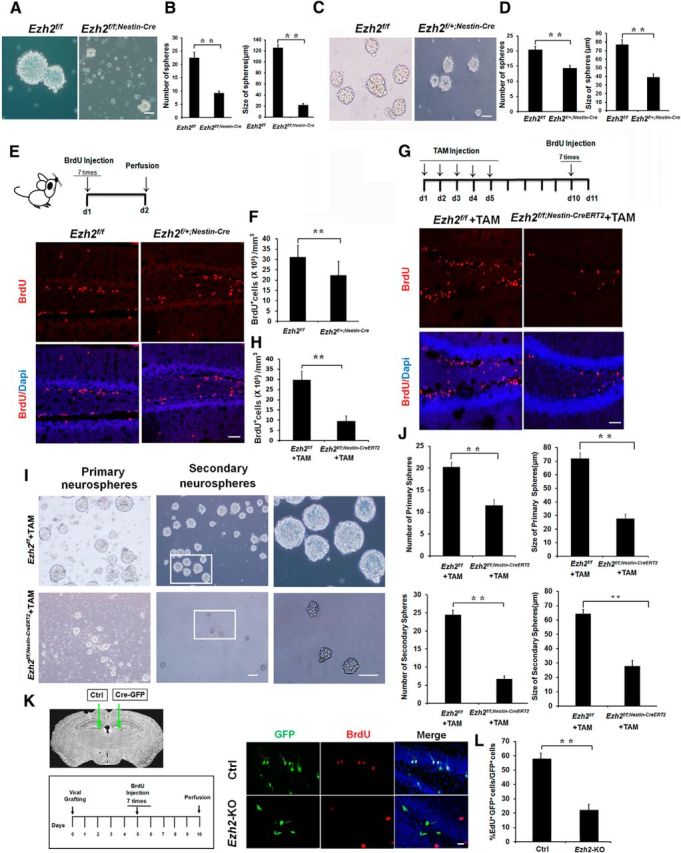
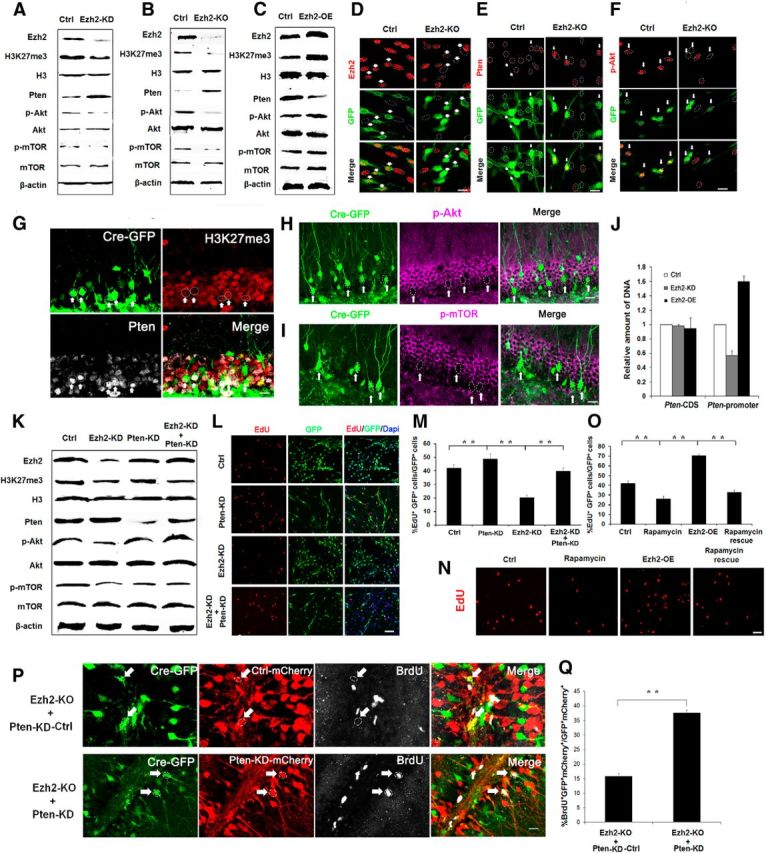
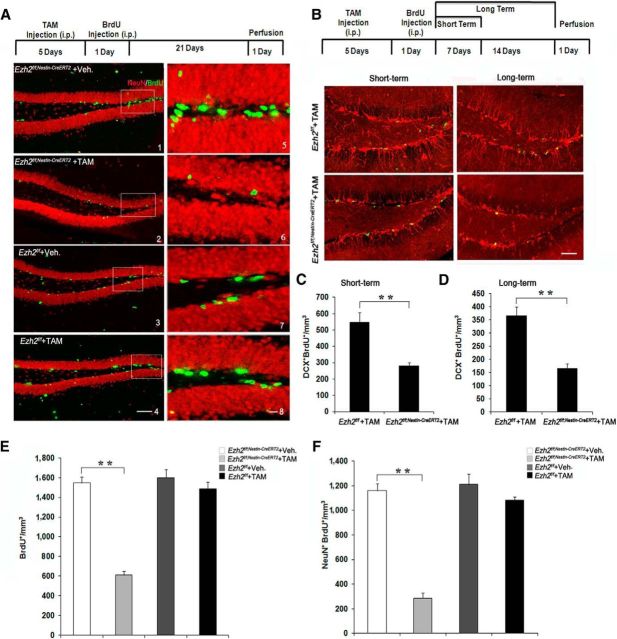
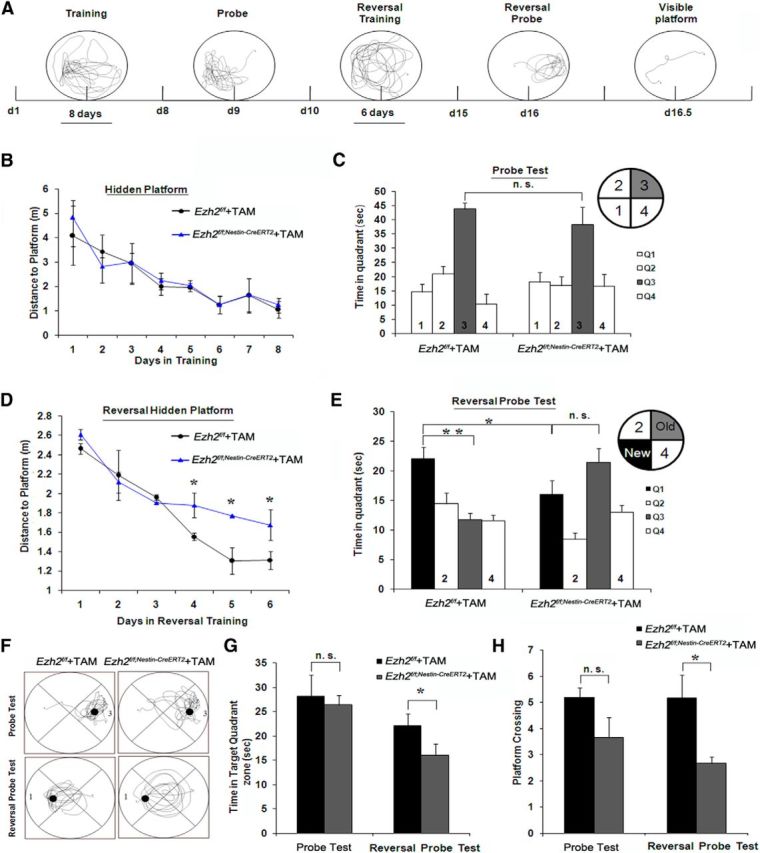
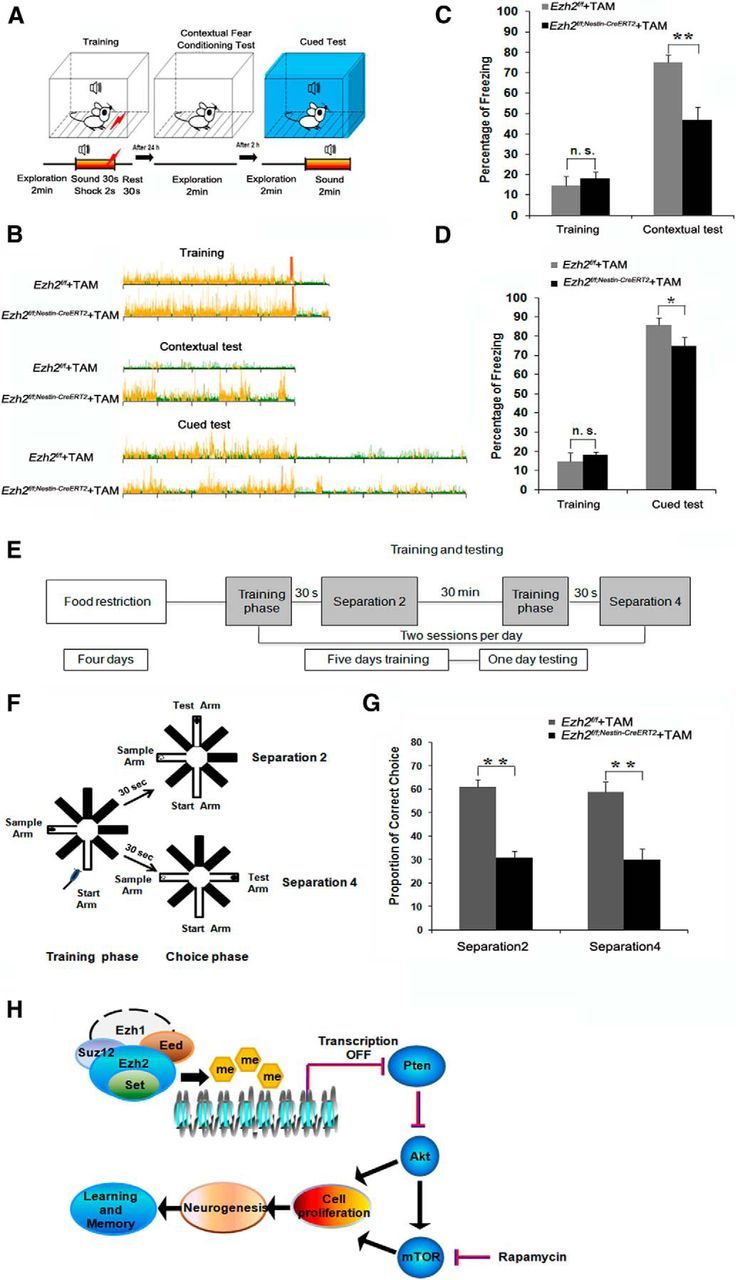
Adult neurogenesis is thought to be crucial for preserving cognitive functions, which is tightly controlled by various epigenetic regulators. As the methyltransferase of histone H3K27, the role of Ezh2 in neurogenesis of adult mice and its mechanism of action are largely unknown. Here, we show that Ezh2 is expressed in actively dividing neural stem cells (NSCs)/progenitor cells as well as mature neurons, but not in quiescent NSCs in the subgranular zone. The deletion of Ezh2 in NSCs/progenitor cells results in a reduction in progenitor cell proliferation. Furthermore, we found that Ezh2 regulates progenitor cell proliferation by suppressing Pten expression and promoting the activation of Akt-mTOR. Moreover, the loss of Ezh2 in progenitor cells leads to a decrease in the number of neurons, which was observed by long-term tracing. Strikingly, conditional knockout of Ezh2 ultimately results in impairments in spatial learning and memory, contextual fear memory, and pattern separation. Our findings demonstrate the essential role of Ezh2 in the proliferation of progenitor cells, thus providing insight into the molecular mechanisms of adult neurogenesis in preserving cognitive functions.

Keywords: Ezh2; adult neural stem cell; hippocampus; learning and memory; neurogenesis.


Figures

Figure 1.
Figure 1.
Ezh2 is expressed in neural progenitor cells, as well as in mature neurons in the hippocampus. A, Ezh2 is expressed in the DG of the hippocampus. Brain sections from 6-week-old C57 mice were evaluated using immunohistochemical analysis with antibodies against Ezh2 in the DG of the hippocampus. B, Ezh2 is expressed in Sox2+ NSCs/progenitor cells. Brain sections were stained with antibodies against Sox2 (red) and Ezh2 (green). Sox2+/Ezh2+ cells are highlighted by the white arrowheads. C, Ezh2 is expressed in Nestin+ NSCs/progenitor cells. Brain sections were stained with antibodies against Nestin (red) and Ezh2 (green). White arrowheads show Nestin+/Ezh2+ cells. D, Ezh2 is expressed in a subset of NeuN cells. Brain sections were stained with antibodies against NeuN (red) and Ezh2 (green). White arrowheads show NeuN/Ezh2+ cells. E, Ezh2 is expressed in in vitro cultured progenitor cells. Primary NSCs/progenitor cells were isolated from the DG of 6-week-old C57 mice and cultured into neurospheres 1 week later. Immunocytochemical analysis was performed on neurospheres or freshly dissociated progenitor cells with antibodies against Ezh2. Scale bar, 50 μm. F, Ezh2 is colabeled with Sox2 in neurospheres and dissociated progenitor cells. G, Ezh2 is colabeled with Nestin in neurospheres and dissociated progenitor cells. H, Western blot analysis showed that Ezh2 is decreased in differentiated progenies. Protein lysates of dissociated progenitor cells in self-renewing conditions (day 0) or in differentiation conditions for increasing lengths of time (days 2 and 6) were probed with antibodies against Ezh2 and β-actin.
Figure 2.
Figure 2.
Ezh2 is expressed in neural progenitor cells but not in quiescent NSCs. A, Ezh2 is not expressed in the majority of radial glia-like cells. Confocal microscopy images of adult hippocampal sections of cells triple labeled for Ezh2 (green), Sox2 or Nestin (white), and GFAP (red). The arrowheads show the Ezh2-negative, but Sox2/Nestin and GFAP double-positive cells. B, Ezh2 is expressed in progenitor cells but not in quiescent NSCs in vitro. Neurospheres were stained with Ezh2 (green), GFAP (red), and Sox2 (yellow). Disassociated cells were labeled with Ezh2 (green), Nestin (red), and Sox2 (white). C, Ezh2 is expressed in active NSCs/progenitor cells but not in quiescent NSCs. Brain sections was triple labeled for Ezh2 (green), GFAP (red), and MCM2 (white). The white arrowheads show Ezh2+GFAP+MCM2+ cells (active NSCs cells) whereas the white triangles show Ezh2 GFAP+MCM2 cells (quiescent NSCs). The solid arrowhead arrows show Ezh2+GFAPMCM2+ progenitor cells. The staining intensity of Ezh2 was quantified in GFAP+MCM2 cells, GFAP+MCM2+ cells, and GFAPMCM2+cells (C′). D, Ezh2 is expressed in transit-amplifying intermediate progenitor cells in the SGZ. Double labeling of Ezh2 (green) and Tbr2 (red) in the adult hippocampal sections. E, Ezh2 is more highly expressed in neuroblasts than in immature neurons. Adult hippocampal section was labeled by Ezh2 (green), DCX (red), and Ki67 (white). The white arrowheads show Ezh2+DCX+Ki67+ cells (neuroblasts) whereas the white triangles show Ezh2DCX+Ki67 cells (immature neurons). The staining intensity of Ezh2 were measured in DCX+/Ki67+ cells and DCX+Ki67 cells (E′). F, Ezh2 staining was detected in proliferating progenitor cells labeled with BrdU. Coimmunostaining of Ezh2 (green) and BrdU (red) in the SGZ. G, Ezh2 is expressed in proliferating progenitor cells in neurospheres. Neurospheres were triple labeled with Ezh2 (green), Sox2 (white), and BrdU (red). H, Ezh2 is highly expressed in cells that are in the cell cycle of neurospheres. Neurospheres were colabeled with Ezh2 (green) and Ki67 (red). The nuclei were stained with DAPI (blue). Scale bar, 50 μm.
Figure 3.
Figure 3.
Ezh2 regulates the proliferation of primary NSCs/progenitor cells isolated from adult DG. A, Western blot analysis showed Ezh2 was effectively suppressed by RNA interference or was upregulated after Ezh2 overexpression. Primary NSCs/progenitor cells were infected with control, Ezh2 shRNA, or Ezh2 overexpression retrovirus. The cell lysates were probed with anti-Ezh2 and β-actin antibodies. B, Proliferation analyses showed that Ezh2 promoted the proliferation of primary NSCs/progenitor cells. Cells infected with control, Ezh2 shRNA, or Ezh2 overexpression retrovirus (GFP) were labeled with EdU (red) and then stained. Scale bar, 100 μm. C, Quantitative analysis showed that there was a higher percentage of EdU incorporation in the Ezh2 overexpressed progenitor cells compared with the control cells, as well as a lower percentage of EdU incorporation in the Ezh2 knockdown progenitor cells. D, Neurospheres were grown for 7 d after retrovirus infection. The increase in sphere size in the Ezh2 retrovirus-infected progenitor cells was apparent, whereas a decrease in sphere size in the Ezh2-shRNA retrovirus-infected progenitor cells was also observed. Scale bar, 50 μm. E, Statistical analysis of the diameters of neurospheres generated at very low densities (one cell per 2 μl of medium) after being infected with retrovirus. F, Western blot analysis showed that Ezh2 was reduced in the Cre recombinase-expressing progenitor cells. Cells were infected with control or Cre retrovirus. The cell lysates were probed with anti-Ezh2 and β-actin antibodies. G, Confocal images showed the selective deletion of Ezh2 in the Cre recombinase-expressing cells, as well as the reduced proliferation of the progenitor cells. Proliferating progenitor cells were labeled with EdU (red). Scale bar, 100 μm. H, Quantitative comparison showed that the number of EdU-positive progenitor cells in the Cre recombinase retrovirus-infected cells was smaller than in the control cells. I, Flow cytometry analysis showed that deletion of Ezh2 resulted in an increase in the percentage of cells in G0/G1 phase. J, Quantification of the percentage of cells in G0/G1 phase. Value represents mean ± SEM. Student's t test; *p < 0.05, **p < 0.01.
Figure 4.
Figure 4.
Deficient progenitor cell proliferation in the adult hippocampus after Ezh2 deletion. A, NSCs/progenitor cells isolated from Ezh2f/f;Nestin-Cre mice displayed a defect in primary neurosphere formation. The number of neurospheres was counted 1 week after the NSCs/progenitor cells were isolated from Ezh2f/f;Nestin-Cre mice and Ezh2f/f littermates. Scale bar, 100 μm. B, NSCs/progenitor cells isolated from Ezh2-deficient mice formed neurospheres at a lower frequency and with a smaller size than those from control mice. The number and size of the neurospheres formed after 1 week were counted and measured. C, NSCs/progenitor cells isolated from Ezh2f/+;Nestin-Cre mice also displayed a defect in primary neurosphere formation. The number of neurospheres was counted 1 week after the NSCs/progenitor cells were isolated from the Ezh2f/+;Nestin-Cre mice and Ezh2f/f littermates. Scale bar, 100 μm. D, NSCs/progenitor cells isolated from Ezh2f/+;Nestin-Cre mice formed neurospheres at a lower frequency and with a smaller size than those from the control mice. The number and size of the neurospheres formed after 1 week were counted and measured. E, Progenitor cell proliferation capability was reduced in the Ezh2f/+;Nestin-Cre mice. Six-month-old Ezh2f/+;Nestin-Cre mice and Ezh2f/f littermates were injected with BrdU seven times in 1 d (once every 2 h) and were killed 1 d after the last BrdU injection. The brain sections were stained with anti-BrdU (red). The nuclei were stained with DAPI (blue). Scale bar, 100 μm. F, Quantification of the BrdU-positive cells in the SGZ of Ezh2f/+;Nestin-Cre mice and Ezh2f/f mice. The number of BrdU-positive cells in the SGZ was normalized to the GCL volume. G, Progenitor cell proliferation was reduced in the Ezh2 icKO mice. Six-month-old Ezh2f/f;Nestin-CreERT2 mice and littermates were treated with tamoxifen for 5 d and were injected with BrdU seven times on the fifth day after the last tamoxifen injection. Sections of the DG were stained with a proliferation marker (red). Scale bar, 100 μm. H, Quantification of the BrdU-labeled cells in the adult hippocampus after the inducible deletion of Ezh2. The number of BrdU-positive cells in the SGZ was normalized to the GCL volume. I, Both primary and secondary neurosphere formation was impaired after conditional Ezh2 deletion. The last section shows images taken from the boxed regions in the middle. NSCs/progenitor cells were isolated from Ezh2f/f;Nestin-CreERT2 mice after 5 d of tamoxifen injection and were cultured into primary neurospheres 1 week later. The dissociated cells from the primary neurospheres formed secondary neurospheres after 1 week. Scale bar, 100 μm. J, Quantitative comparison of neurosphere formation in Ezh2 icKO mice and Ezh2f/f mice. K, Ezh2 deletion in Ezh2f/f mice, mediated by Cre recombinase, resulted in reduced BrdU incorporation. Concentrated retroviruses expressing the control or Cre recombinase were injected stereotaxically into the left and right DG of the Ezh2f/f mice, respectively. Scale bar, 100 μm. L, Quantitative comparison of the BrdU-positive progenitor cells that were infected with retrovirus. Value represents mean ± SEM. Student's t test; *p < 0.05, **p < 0.01.
Figure 5.
Figure 5.
Ezh2 regulates progenitor cell proliferation through the Pten-Akt-mTOR signaling pathway. A, Ezh2 knockdown increased Pten levels and decreased the levels of H3K27me3, p-Akt, and p-mTOR in primary NSCs/progenitor cells. Western blot analysis of the protein extracts from progenitor cells infected with control and Ezh2-shRNA retrovirus. B, Ezh2 deletion, mediated by Cre recombinase, increased the levels of Pten level and decreased the levels of p-Akt and p-mTOR. Western blot analysis of the protein extracts from progenitor cells infected with Cre retrovirus and the control. C, Western blotting showing the expression of Ezh2, H3K27me3, Pten, p-AKT, and p-mTOR in Ezh2 overexpressed primary NSCs/progenitor cells. D, Confocal images show that Ezh2 expression is rare detected in Cre retrovirus-infected progenitor cells. E, Immunofluorescent analysis showed activation of Pten in the Ezh2-deleted progenitor cells. Cells infected with retrovirus were stained with antibodies against Pten (red). Scale bar, 20 μm. F, Immunofluorescent analysis showed that p-Akt was suppressed in the Ezh2-deleted progenitor cells. Cells infected with retrovirus were stained with antibodies against p-Akt (red). Scale bar, 20 μm. G, Ezh2 loss leads to reduced H3K27me3 immunoreactivity and increased Pten expression in vivo. Concentrated retroviruses expressing Cre recombinase/GFP were injected stereotaxically into the DG of the Ezh2f/f mice. Brain sections were marked by antibody of H3K27me3 (red) and Pten (white). White arrowheads show GFP+/H3K27/Pten+ cells. H, Ezh2 ablation results in decreased p-AKT immunoreactivity in the DG of adult hippocampus. White arrowheads show GFP+/p-AKT cells. I, Ezh2 deletion leads to reduced p-mTOR immunoreactivity in the DG of adult hippocampus. White arrowheads show GFP+/p-mTOR cells. J, ChIP analysis showed that Ezh2 inhibited Pten expression by promoting H3K27 methylation on the Pten promoter. Cells infected control, Ezh2 shRNA, and Ezh2 overexpression retrovirus were harvested and sonicated. DNA fragments were quantified using real-time PCR with primers for the Pten promoter and for the Pten coding sequences. K, Western blot analysis showing that Pten knockdown can rescue the expression of p-AKT and p-mTOR when Ezh2 was knocked down. L, Knockdown of Pten using a lentivirus expressing Pten siRNA rescued the decrease in progenitor cell proliferation that resulted from Ezh2 knockdown. Progenitor cells were infected with control or Ezh2-shRNA retrovirus or were coinfected with Pten-shRNA lentivirus and Ezh2-shRNA retrovirus. The proliferating cells were labeled with EdU (red). Scale bar, 20 μm. M, Quantitative analysis of the EdU-labeled cells. N, Rapamycin treatment rescued the increased proliferation caused by Ezh2 overexpression. Progenitor cells were infected with Ezh2 overexpression retrovirus and then treated with 0.3 nm rapamycin. The proliferating cells were traced with EdU (red). Scale bar, 100 μm. O, Quantitative analysis of the EdU-labeled cells. P, Pten knockdown mediated by lentivirus infection can rescue the decrease of progenitor cell proliferation caused by Ezh2 deletion. Viruses that express Cre recombinase/GFP or pten-KD/mCherry were mixed and injected stereotaxically into the DG of Ezh2f/f mice. Proliferated cells were labeled by BrdU injection. Q, Percentage of BrdU-positive cells in GFP and mCherry colabeled cells. Value represents mean ± SEM. Student's t test; *p < 0.05, **p < 0.01.
Figure 6.
Figure 6.
Loss of Ezh2 results in a decrease in neurogenesis in the SGZ. A, Representative sections of the DG stained with the mature neuron marker NeuN (red) and the proliferation marker BrdU (green) 3 weeks after 5 d of tamoxifen or vehicle treatment. 5—8, Enlarged images taken from boxed regions in 1–4. Scale bar, 100 μm. B, Number of newly born neurons decreased after the inducible deletion of Ezh2 in both short-and long-term experiments. BrdU was injected on the fifth day after tamoxifen treatment. Mice were killed either 1 week later (short term) or 3 weeks later (long term). Representative sections of the DG were stained with the immature neuron marker DCX (red) and the proliferation marker BrdU (green). Scale bar, 100 μm. C, Quantification of the DCX+/BrdU+ cells in the short-term period following Ezh2 deletion. D, Quantification of the DCX+/BrdU+ cells in the long-term period following Ezh2 deletion. E, The number of surviving BrdU-positive cells decreased in the adult hippocampus 3 weeks after the inducible deletion of Ezh2. The number of BrdU-labeled cells was normalized to the volume of the DG. F, Quantitative analysis of the reduced number of new neurons (BrdU and NeuN double-labeled cells) observed in B. Value represent mean ± SEM. Student's t test; *p < 0.05, **p < 0.01.
Figure 7.
Figure 7.
Deletion of Ezh2 from NSCs results in impaired spatial learning and memory. A, Schematic illustration of the experimental design. Mice were trained for 8 d in the Morris water maze and tested 24 h later. They were then subjected to 6 d of reversal training by transferring the hidden platform to the opposite quadrant of the water maze. Reversal probe test was performed 24 h later, followed by a visible platform test. B, Swim distance to the platform decreased during the training process, and there was no significant difference between Ezh2 icKO mice and control mice, indicating a similar spatial learning ability. C, Ezh2 icKO mice spent a similar amount of time in the target quadrant as the control mice in the probe test. D, Ezh2 icKO mice swam longer distances than the control mice after 4 d of reversal training, indicating that they suffered from impaired learning of new spatial learning. E, Ezh2 icKO mice spent less time in the target quadrant than control mice during the reversal probe test. In contrast, control mice spent more time in the new target quadrant than in the old one. F, Representative tracing pathway of control and Ezh2 icKO mice in the probe test and the reversal probe test. G, Ezh2 icKO mice also spent less time in the area of the target platform after the hidden platform was removed in the reversal probe test. H, Crossing times of Ezh2 icKO mice were fewer than control mice in the reversal probe test. Value represents mean ± SEM. One-way ANOVA; *p < 0.05, **p < 0.01.
Figure 8.
Figure 8.
Ablation of Ezh2 leads to impairments in contextual fear memory and deficits in pattern separation. A, Schematic illustration of the experiment designed for fear conditioning. Ezh2 icKO mice and their littermate controls were subjected to 30 s of sound and a 2 s of footshock with 0.7 mA current. Contextual fear-conditioning test was performed 24 h later, followed by a cued test 2 h later. B, Behavioral distributions of Ezh2 icKO mice and controls during training and testing. C, Percentage of freezing in Ezh2 icKO mice was less than in littermate controls when exploring the same background. D, Freezing response was reduced in the Ezh2 icKO mice compared with the controls in the tone-cued test. E, Timeline for the radial arm maze pattern separation assay. Mice were dieted for 4 d and then trained for 5 d. The test was performed 24 h later. F, Schematic illustration of the experimental design. G, Ezh2 icKO mice made fewer correct choices in both separation 2 and separation 4. H, Model for Ezh2's role in regulating adult neurogenesis and cognitive function. Value represents mean ± SEM. One-way ANOVA; *p < 0.05, **p < 0.01.

References

    1. Alvarez-Buylla A, Lim DA. For the long run: maintaining germinal niches in the adult brain. Neuron. 2004;41:683–686. doi: 10.1016/S0896-6273(04)00111-4. - DOI - PubMed
    1. Amiri A, Cho W, Zhou J, Birnbaum SG, Sinton CM, McKay RM, Parada LF. Pten deletion in adult hippocampal neural stem/progenitor cells causes cellular abnormalities and alters neurogenesis. J Neurosci. 2012;32:5880–5890. doi: 10.1523/JNEUROSCI.5462-11.2012. - DOI - PMC - PubMed
    1. Battiste J, Helms AW, Kim EJ, Savage TK, Lagace DC, Mandyam CD, Eisch AJ, Miyoshi G, Johnson JE. Ascl1 defines sequentially generated lineage-restricted neuronal and oligodendrocyte precursor cells in the spinal cord. Development. 2007;134:285–293. doi: 10.1242/dev.02727. - DOI - PubMed
    1. Bonaguidi MA, Wheeler MA, Shapiro JS, Stadel RP, Sun GJ, Ming GL, Song H. In vivo clonal analysis reveals self-renewing and multipotent adult neural stem cell characteristics. Cell. 2011;145:1142–1155. doi: 10.1016/j.cell.2011.05.024. - DOI - PMC - PubMed
    1. Cetin A, Komai S, Eliava M, Seeburg PH, Osten P. Stereotaxic gene delivery in the rodent brain. Nat Protoc. 2006;1:3166–3173. - PubMed

Publication types

MeSH terms

Substances