Temporal analysis of reference frames in parietal cortex area 5d during reach planning
- PMID: 24719105
- PMCID: PMC3983803
- DOI: 10.1523/JNEUROSCI.2068-13.2014
Temporal analysis of reference frames in parietal cortex area 5d during reach planning
Abstract
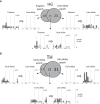
The neural encoding of spatial and postural reference frames in posterior parietal cortex has traditionally been studied during fixed epochs, but the temporal evolution of these representations (or lack thereof) can provide insight into the underlying computations and functions of this region. Here we present single-unit data recorded from two rhesus macaques during a reach planning task. We found that area 5d coded the position of the hand relative to gaze before presentation of the reach target, but switched to coding the target location relative to hand position soon after target presentation. In the pretarget period the most relevant information for success in the task is the position of the hand relative to gaze; however, after target onset, the most task-relevant spatial relationship is the location of the target relative to the hand. The switch in coding suggests that population activity in area 5d may represent postural and spatial information in the reference frame that is most pertinent at each stage of the task. Moreover, although target-hand coding was dominant from soon after the reach target onset, this representation was not static but built in strength as movement onset approached, which we speculate could reflect a role for this region in building an accurate state estimate for the limb. We conclude that representations in area 5d are more flexible and dynamic than previously reported.
Keywords: monkey; neurophysiology; parietal; reaching; reference frames.
Figures


Similar articles
-
Temporal stability of reference frames in monkey area V6A during a reaching task in 3D space.Brain Struct Funct. 2017 May;222(4):1959-1970. doi: 10.1007/s00429-016-1319-5. Epub 2016 Oct 1. Brain Struct Funct. 2017. PMID: 27696004
-
Neural coding of action in three dimensions: Task- and time-invariant reference frames for visuospatial and motor-related activity in parietal area V6A.J Comp Neurol. 2020 Dec 1;528(17):3108-3122. doi: 10.1002/cne.24889. Epub 2020 Feb 28. J Comp Neurol. 2020. PMID: 32080849
-
Neural representation during visually guided reaching in macaque posterior parietal cortex.J Neurophysiol. 2010 Dec;104(6):3494-509. doi: 10.1152/jn.01050.2009. Epub 2010 Sep 15. J Neurophysiol. 2010. PMID: 20844104 Free PMC article.
-
Parieto-frontal coding of reaching: an integrated framework.Exp Brain Res. 1999 Dec;129(3):325-46. doi: 10.1007/s002210050902. Exp Brain Res. 1999. PMID: 10591906 Review.
-
Gaze effects in the cerebral cortex: reference frames for space coding and action.Exp Brain Res. 1999 Sep;128(1-2):170-80. doi: 10.1007/s002210050832. Exp Brain Res. 1999. PMID: 10473755 Review.
Cited by
-
Cognition in Sensorimotor Control: Interfacing With the Posterior Parietal Cortex.Front Neurosci. 2019 Feb 27;13:140. doi: 10.3389/fnins.2019.00140. eCollection 2019. Front Neurosci. 2019. PMID: 30872993 Free PMC article.
-
Perisaccadic Updating of Visual Representations and Attentional States: Linking Behavior and Neurophysiology.Front Syst Neurosci. 2016 Feb 5;10:3. doi: 10.3389/fnsys.2016.00003. eCollection 2016. Front Syst Neurosci. 2016. PMID: 26903820 Free PMC article. Review.
-
Spatiotemporal transformations for gaze control.Physiol Rep. 2020 Aug;8(16):e14533. doi: 10.14814/phy2.14533. Physiol Rep. 2020. PMID: 32812395 Free PMC article. Review.
-
Flexible egocentric and allocentric representations of heading signals in parietal cortex.Proc Natl Acad Sci U S A. 2018 Apr 3;115(14):E3305-E3312. doi: 10.1073/pnas.1715625115. Epub 2018 Mar 19. Proc Natl Acad Sci U S A. 2018. PMID: 29555744 Free PMC article.
-
Reference frames for reaching when decoupling eye and target position in depth and direction.Sci Rep. 2016 Feb 15;6:21646. doi: 10.1038/srep21646. Sci Rep. 2016. PMID: 26876496 Free PMC article.
References
-
- Andersen RA, Snyder LH, Batista AP, Buneo CA, Cohen YE. Posterior parietal areas specialized for eye movements (LIP) and reach (PRR) using a common coordinate frame. Novartis Found Symp. 1998;218:109–122. discussion 122–108, 171–105. - PubMed
Publication types
MeSH terms
Grants and funding
LinkOut - more resources
Full Text Sources
Other Literature Sources
