. 2014 Apr 9;34(15):5291-301.
doi: 10.1523/JNEUROSCI.4888-13.2014.

Auditory thalamus and auditory cortex are equally modulated by context during flexible categorization of sounds

Affiliations

Auditory thalamus and auditory cortex are equally modulated by context during flexible categorization of sounds

Santiago Jaramillo et al. J Neurosci. .

Abstract

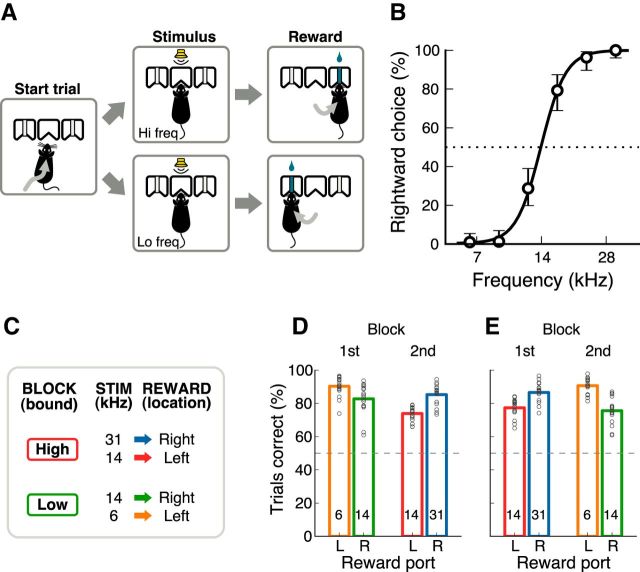
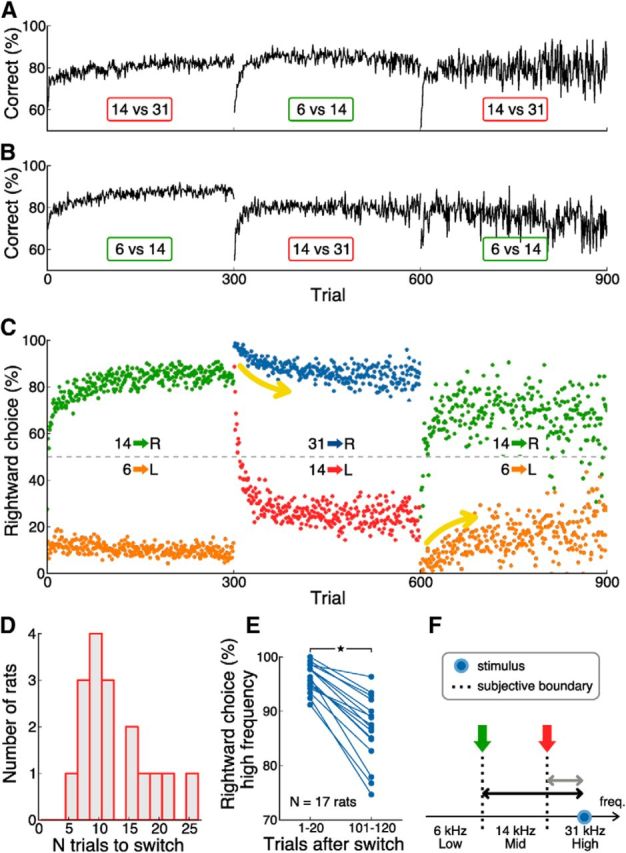
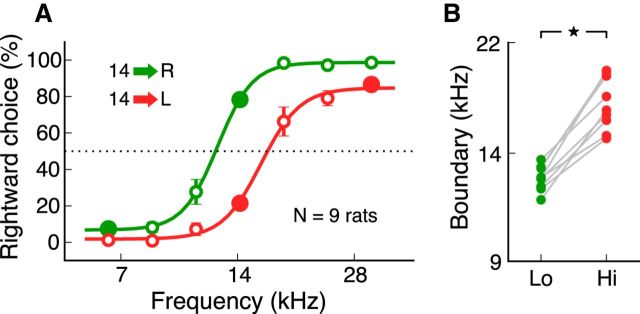
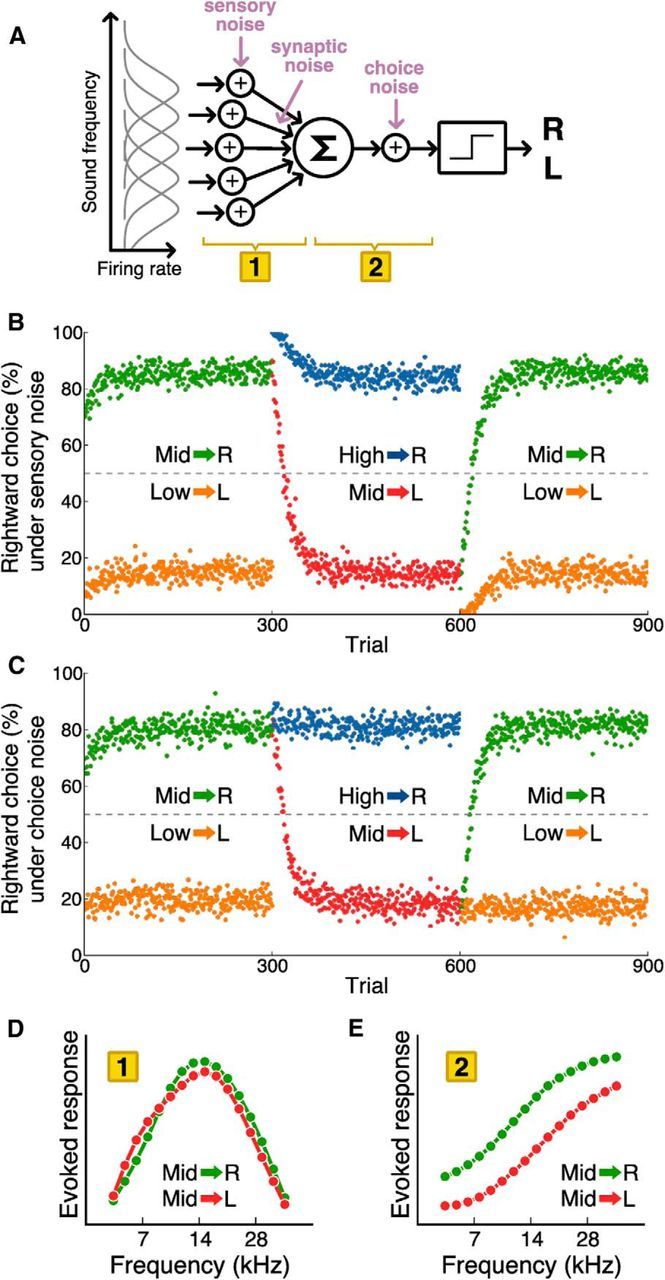
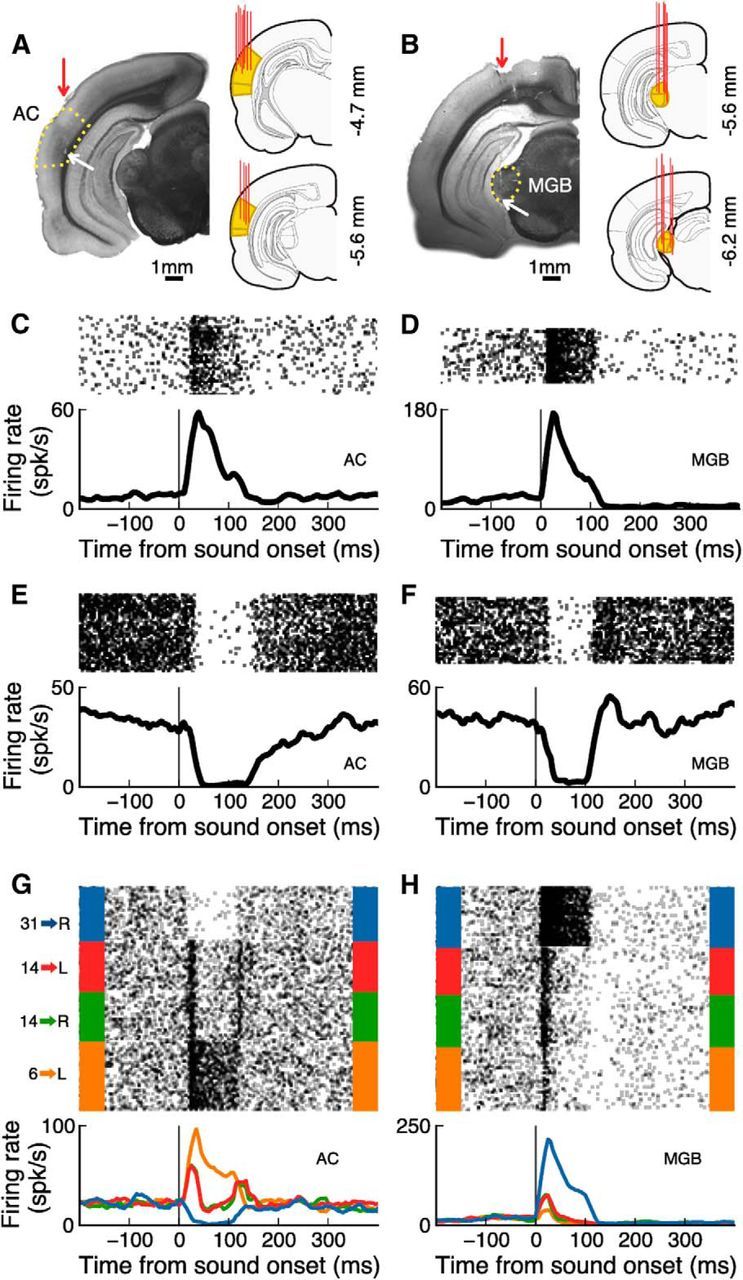
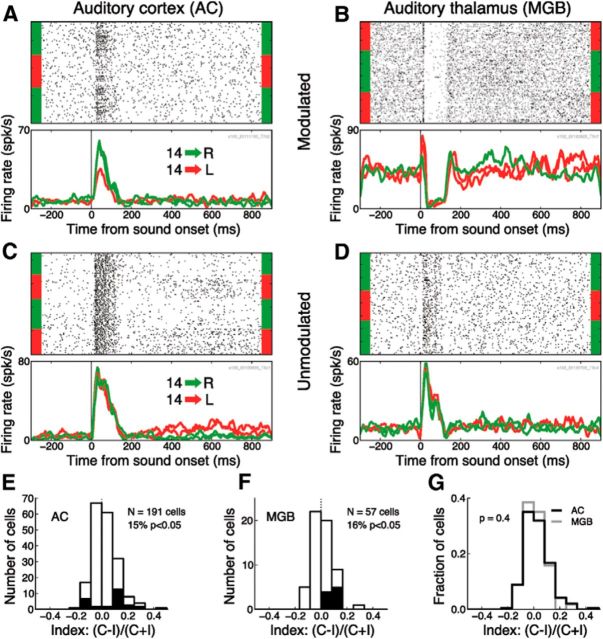
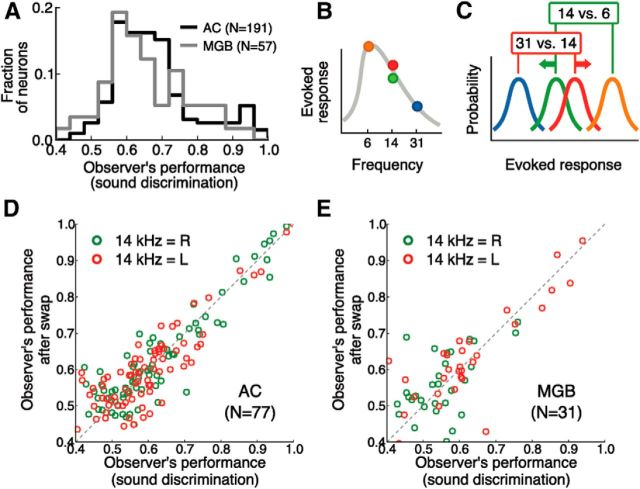
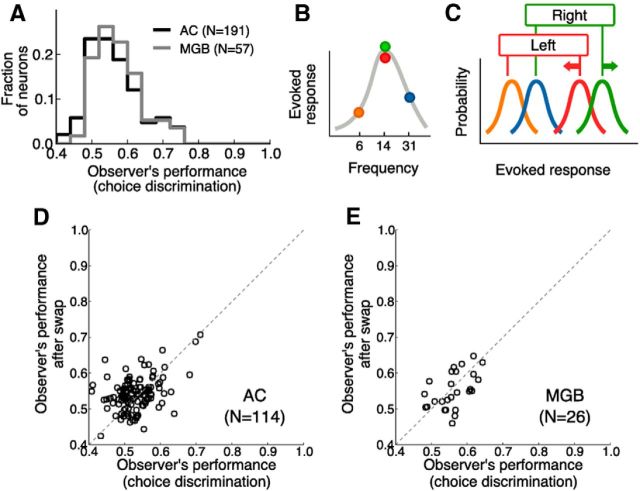
In a dynamic world, animals must adapt rapidly to changes in the meaning of environmental cues. Such changes can influence the neural representation of sensory stimuli. Previous studies have shown that associating a stimulus with a reward or punishment can modulate neural activity in the auditory cortex (AC) and its thalamic input, the medial geniculate body (MGB). However, it is not known whether changes in stimulus-action associations alone can also modulate neural responses in these areas. We designed a categorization task for rats in which the boundary that separated low- from high-frequency sounds varied several times within a behavioral session, thus allowing us to manipulate the action associated with some sounds without changing the associated reward. We developed a computational model that accounted for the rats' performance and compared predictions from this model with sound-evoked responses from single neurons in AC and MGB in animals performing this task. We found that the responses of 15% of AC neurons and 16% of MGB neurons were modulated by changes in stimulus-action association and that the magnitude of the modulation was comparable between the two brain areas. Our results suggest that the AC and thalamus play only a limited role in mediating changes in associations between acoustic stimuli and behavioral responses.

Keywords: auditory; categorization; flexibility; reward; stimulus–action association.


Figures

Figure 1.
Figure 1.
Flexible sound-categorization task. A, Rats initiated each trial by poking their noses into the center port of a three-port chamber. A narrow-band sound was presented for 100 ms, indicating the location of reward: left for low-frequency sounds and right for high-frequency sounds. B, Psychometric performance for one rat during one discrimination session demonstrating that animals can achieve perfect performance on easy discriminations (6 vs 31 kHz; error bars are 95% confidence intervals). C, To introduce flexibility in the task, each session consisted of alternating blocks of 300 trials: in one block type, rats were required to discriminate between 31 and 14 kHz; in the other block type, between 14 and 6 kHz. This was equivalent to setting the category boundary to either a “high” or a “low” frequency value. The middle frequency sound (14 kHz) changed its meaning from one block type to the other. D, Average performance for each of the 17 rats on the first and second blocks of trials when the task started on the low-boundary block. Each circle corresponds to the average performance across multiple sessions for one animal for each stimulus, ignoring the first 100 trials after a block switch. Chance level was 50%. E, Same as D, but when the task started on a high-boundary block. Performance level was above chance in all conditions, but consistently lower for the reversing stimulus (14 kHz).
Figure 2.
Figure 2.
Switching contingencies affected responses to all stimuli. A, Average performance across sound-action associations for an initial cohort of 12 rats (trained in parallel) on sessions that started with the high-boundary block. Blocks were 300 trials long. Averages were calculated for each trial across sessions and animals without time averaging. The increased variability on the last trials is due to averaging across less number of samples because not all animals performed 900 trials. B, Same as in A, but for sessions that started with the low-boundary block. C, Average performance across rats in A for each sound–action association. Each dot represents the percentage of rightward choices for one trial in a session taken across several sessions from each animal. This plot shows only sessions that started with the low-boundary block. Yellow arrows indicate how performance also changed for stimuli that never changed their associated category. Increased variability on the last trials is due to fewer samples, as explained in A. D, Number of trials required to switch sound-action associations for each of the 17 animals trained in the full task. The value plotted corresponds to the trial in which each animal crossed the 50% level of rightward choices for the reversing stimulus (14 kHz) after the first block switch. Most rats switched before 12 trials. E, Change in behavioral responses for a sound that never changed association. Each dot is the percentage of rightward choices for each of the 17 animals in response to the 31 kHz sound in trials 1–20 or 101–120 after a switch. A decay in performance is evident for all rats. F, Illustration of the shift in subjective category boundary that accounts for the decay in performance in E. At the end of the first block and the beginning of the second block, the boundary is located between 6 and 14 kHz (green arrow). In this case, the distance between the boundary and 31 kHz is large and small noise will not change the location of the stimulus with respect to the boundary. As the subject is exposed to more trials from the second block, the boundary shifts between 14 and 31 kHz (red arrow). Under this condition, noise in the representation of either the stimulus or the boundary may cause a flip in the relation between stimulus and boundary, causing a mistake in choice.
Figure 3.
Figure 3.
Rats' subjective categorization boundary shifted between blocks of trials. A, Average psychometric curves across animals. Red and green correspond to estimates from the low-boundary and high-boundary blocks, respectively, from the nine rats tested. In 10% of trials (open circles), animals were probed with frequencies different from those in the training set (solid circles). Each circle indicates the average of rightward choices for each frequency across animals, ignoring the first 100 trials after a switch. Error bars indicate SEs. Curves correspond to logistic fits given the choice for each trial. B, All rats shifted their internal categorization boundary between blocks of trials. Each dot represents the estimated boundary from the logistic fit for each animal.
Figure 4.
Figure 4.
An adaptive system with noisy representations accounted for the dynamics of behavioral performance. A, Learning model. Yellow labels indicate each stage. Inputs (stage 1) correspond to frequency channels with imperfect (noisy) representations of the acoustic stimulus. A decision neuron (stage 2) sums these inputs, weighted by the strength of each synapse. These strengths change according to the outcome of each trial. The binary output indicates either a left or right choice. Noise was added at one of three locations: the sensory signals, the synaptic strengths, or the choice signal. B, Average performance on each trial when noise was added to the sensory signals. The noise parameter was chosen so that asymptotic performance for the extreme frequencies matched that of the rats. This model reproduced the decay in performance for the high frequency (in blue). C, Average performance when noise was added to the choice signals. This model did not account for the decay in performance after a contingency switch. D, Simulated evoked responses for a sensory neuron (stage 1, tuned to the middle frequency) are similar between the two contingencies (green: low-boundary; red: high-boundary). E, Simulated responses of the decision neuron (stage 2) depend on both the stimulus and its meaning.
Figure 5.
Figure 5.
Physiological responses to sounds were similar between cortical and thalamic cells during the task. A, Reconstruction of electrode tracks from the AC. Left, Coronal slice showing an example track. The red arrow indicates where the electrode was inserted. The white arrow indicates the electrolytic lesion at the end the recordings. Right, Reconstruction of all electrodes (red) from all animals projected onto the closest of the coronal slices shown (projected onto the left hemisphere). The yellow area includes the primary and ventral fields of the AC (Doron et al., 2002). The number indicates the distance from bregma. B, Same as A, but for the thalamic recordings. The yellow area includes all subnuclei of the MGB (Paxinos and Watson, 2005). C, Sound-evoked response of one cortical cell that increased its firing after the presentation of one of the target sounds. D, Thalamic cell with a response similar to that in C. E, Example physiological response of one cortical cell that decreased its firing after the presentation of one of the target sounds. F, Thalamic cell with a response similar to that in E. G, Response of a cortical cell to the target sounds in each of the four stimulus–action conditions. H, Response of a thalamic cell in each condition. The same cell can show different response dynamics depending on sound frequency.
Figure 6.
Figure 6.
A subset of neurons in thalamus and cortex were sensitive to context. A, Responses evoked by the reversing (14 kHz) sound for a cortical neuron that was sensitive to the meaning of the stimulus. Trials in the raster plot (top) are grouped by the block in which they were presented (three consecutive blocks in this case). The poststimulus time histogram (bottom) shows a clear difference between responses to the 14 kHz sound when it indicated right versus left reward. B, Same as A, but for a thalamic neuron sensitive to the meaning of the stimulus. In this example, the modulation is most apparent in the onset (0–50 ms) of the response. C, Evoked responses for a cortical neuron that was not modulated by context. D, Evoked responses for a thalamic neuron that was not modulated by context. E, The response of 15% of cortical cells was significantly modulated by context. The histogram shows the modulation index for each cell that was responsive to the reversing (14 kHz) sound. Those in black were significantly modulated (p < 0.05, rank-sum test). “C” and “I” are firing rates on trials with reward contralateral or ipsilateral to the recording site, respectively. F, Similar to E, the response of 16% of thalamic cells was significantly modulated by context. G, Overlaid histograms for cortical (E) and thalamic (F) cells. There was no difference in the magnitude of modulation between cells from these brain areas.
Figure 7.
Figure 7.
Discriminability of sounds from evoked responses was similar between AC and MGB. A, Sound-discrimination performance of an ideal observer for neurons of the AC (black) or the MGB (gray) responsive to the reversing stimulus. Discrimination performance was calculated separately on each of the two contingencies; only the highest of these two values was included in the histogram. The distributions of neuronal performance were indistinguishable between cortical and thalamic cells. B, Frequency tuning of a hypothetical neuron with preference for low frequencies. Each dot represents the evoked response for one stimulus in our task (colors as in Fig. 1C). C, Modulation of evoked responses predicted by the “adaptive system” hypothesis for the neuron in B. Changes in the response to 14 kHz in the direction indicated by the arrows improve the discriminability of sounds on each contingency (31 vs 14 kHz and 14 vs 6 kHz). D, Effect of swapping trials with 14 kHz stimulus for cortical neurons tuned to high or low frequencies. Each dot corresponds to the observer's performance given the responses of one neuron on each contingency (green: low-boundary; red: high-boundary). If modulation of responses enhanced discriminability, then the performance of the ideal observer should have decreased after swapping trials, yet there was no apparent decrease. E, Same as D, but for thalamic neurons. There was no decrease in performance after swapping trials.
Figure 8.
Figure 8.
Discriminability of choices from sound-evoked responses. A, Choice-discrimination performance of an ideal observer given neurons from the AC (black) or the MGB (gray) responsive to the reversing stimulus. The distributions of neuronal performance were indistinguishable between cortical and thalamic cells. B, Frequency tuning of a hypothetical neuron with preference for the middle (14 kHz) frequency. C, Modulation of evoked responses predicted by the “representation of choice” hypothesis for the neuron in B. Changes in the response to 14 kHz in the direction indicated by the arrows improve the discriminability of the animal's choice. D, Effect of swapping trials with 14 kHz stimulus for cortical neurons tuned to the middle frequency. Each dot corresponds to the observer's performance given one neuron. If modulation of responses enhanced discriminability, then the performance of the ideal observer should have decreased after swapping trials, yet there was no apparent decrease. E, Same as D, but for thalamic neurons. There was no decrease in performance after swapping trials.

Similar articles

Cited by

References

    1. Albanese D, Visintainer R, Merler S, Riccadonna S, Jurman G, Furlanello C. mlpy: Machine Learning Python. 2012. Retrieved Feb. 5, 2014, from http://arxiv.org/abs/1202.6548.
    1. Bishop CM. Neural networks for pattern recognition. Oxford: OUP; 1995.
    1. Britten KH, Newsome WT, Shadlen MN, Celebrini S, Movshon JA. A relationship between behavioral choice and the visual responses of neurons in macaque MT. Vis Neurosci. 1996;13:87–100. doi: 10.1017/S095252380000715X. - DOI - PubMed
    1. Brosch M, Selezneva E, Scheich H. Nonauditory events of a behavioral procedure activate auditory cortex of highly trained monkeys. J Neurosci. 2005;25:6797–6806. doi: 10.1523/JNEUROSCI.1571-05.2005. - DOI - PMC - PubMed
    1. Chechik G, Anderson MJ, Bar-Yosef O, Young ED, Tishby N, Nelken I. Reduction of information redundancy in the ascending auditory pathway. Neuron. 2006;51:359–368. doi: 10.1016/j.neuron.2006.06.030. - DOI - PubMed

Publication types

LinkOut - more resources