

Multiscale and multi-modality visualization of angiogenesis in a human breast cancer model
- PMID: 24719185
- PMCID: PMC5538401
- DOI: 10.1007/s10456-014-9429-2
Multiscale and multi-modality visualization of angiogenesis in a human breast cancer model
Abstract
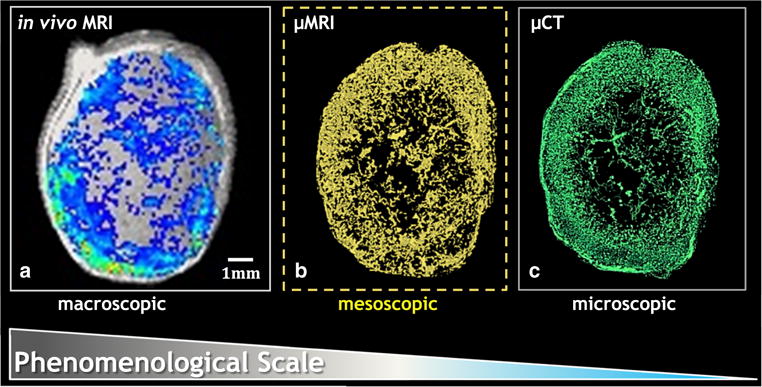
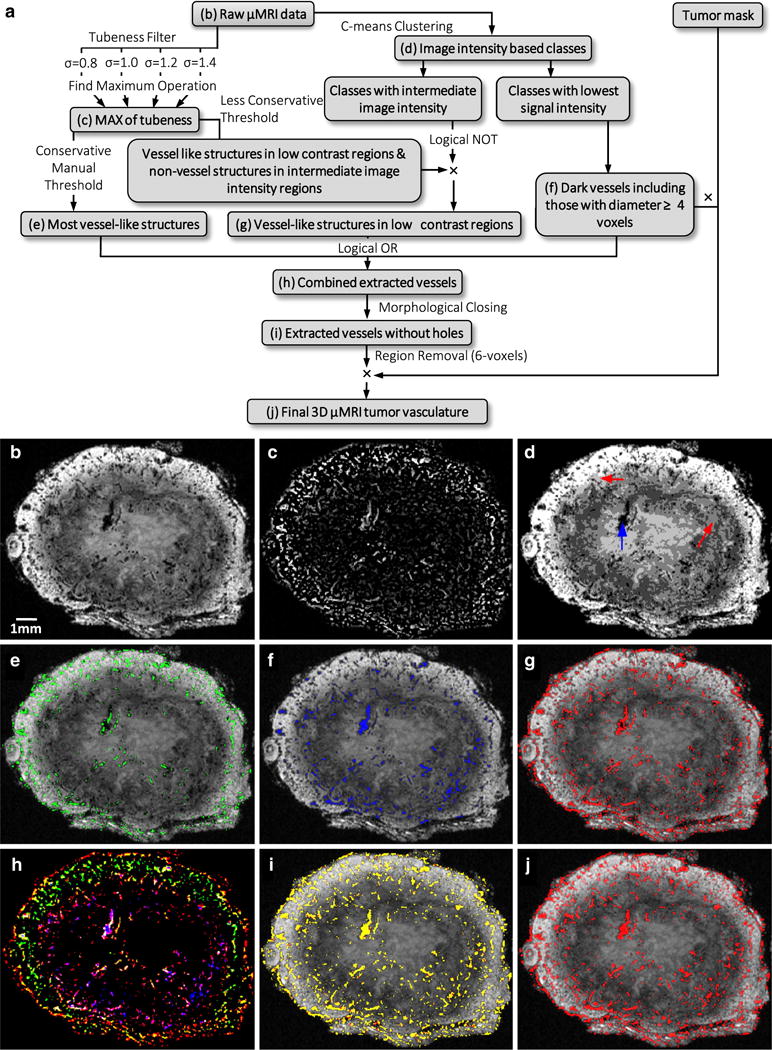
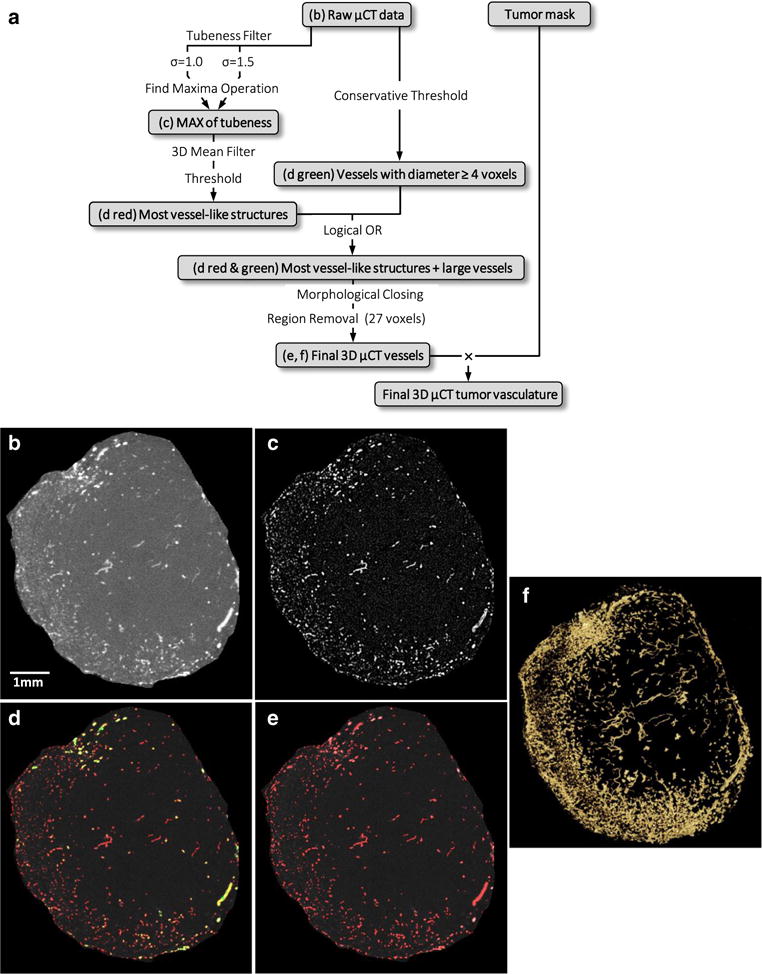
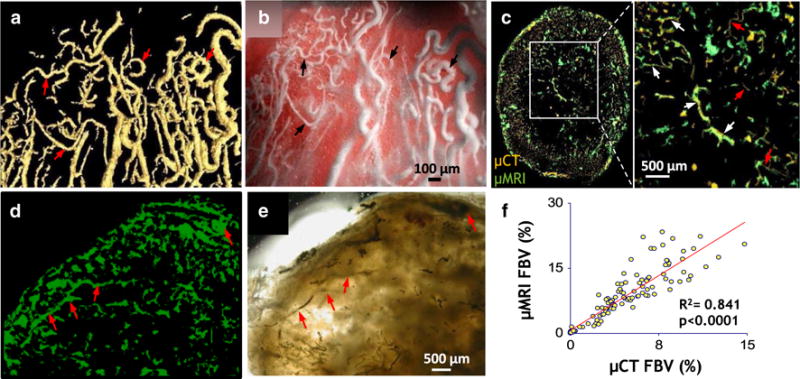
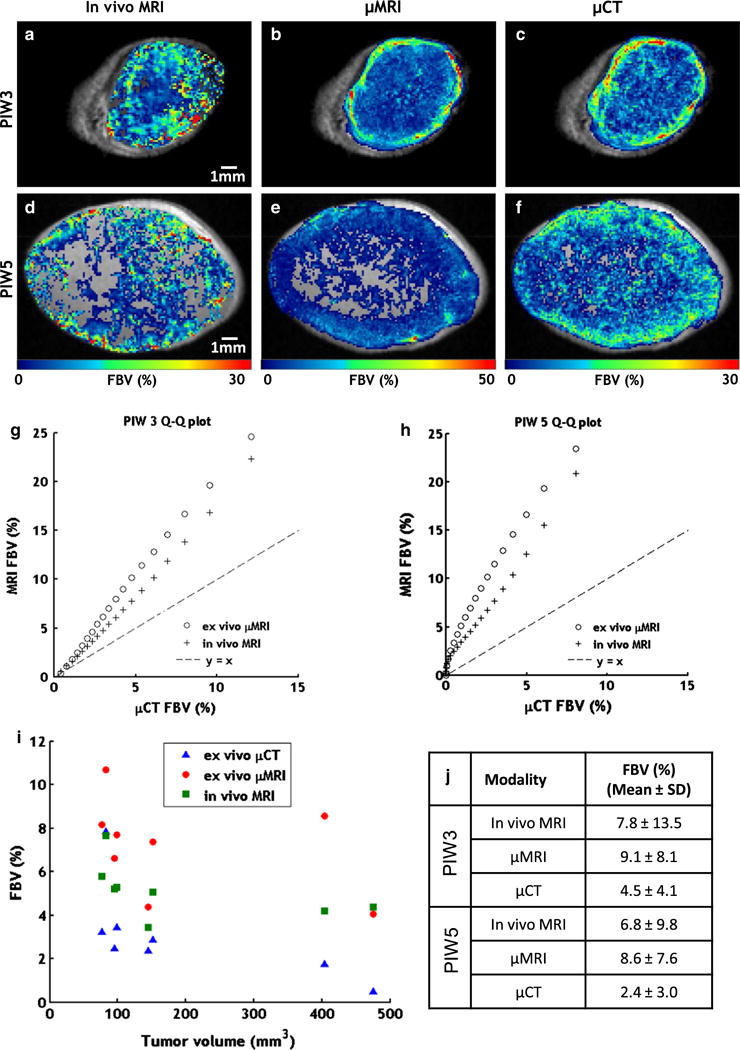
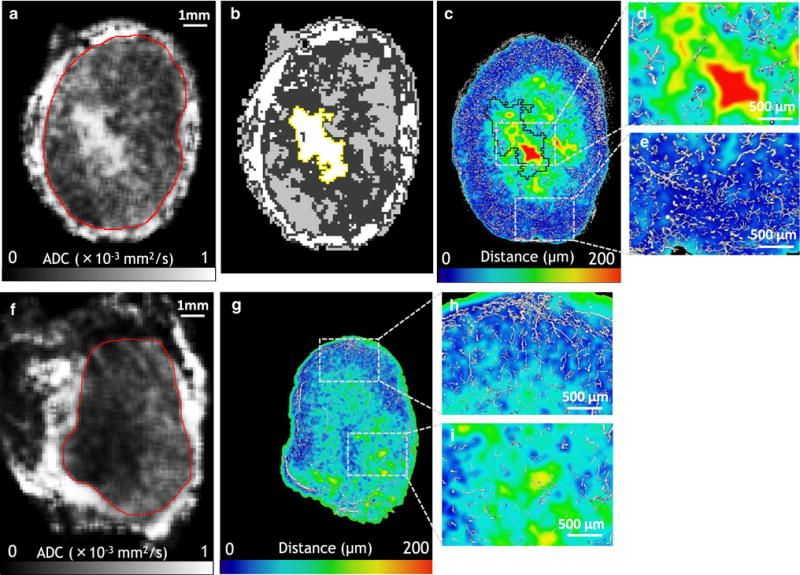
Angiogenesis in breast cancer helps fulfill the metabolic demands of the progressing tumor and plays a critical role in tumor metastasis. Therefore, various imaging modalities have been used to characterize tumor angiogenesis. While micro-CT (μCT) is a powerful tool for analyzing the tumor microvascular architecture at micron-scale resolution, magnetic resonance imaging (MRI) with its sub-millimeter resolution is useful for obtaining in vivo vascular data (e.g. tumor blood volume and vessel size index). However, integration of these microscopic and macroscopic angiogenesis data across spatial resolutions remains challenging. Here we demonstrate the feasibility of 'multiscale' angiogenesis imaging in a human breast cancer model, wherein we bridge the resolution gap between ex vivo μCT and in vivo MRI using intermediate resolution ex vivo MR microscopy (μMRI). To achieve this integration, we developed suitable vessel segmentation techniques for the ex vivo imaging data and co-registered the vascular data from all three imaging modalities. We showcase two applications of this multiscale, multi-modality imaging approach: (1) creation of co-registered maps of vascular volume from three independent imaging modalities, and (2) visualization of differences in tumor vasculature between viable and necrotic tumor regions by integrating μCT vascular data with tumor cellularity data obtained using diffusion-weighted MRI. Collectively, these results demonstrate the utility of 'mesoscopic' resolution μMRI for integrating macroscopic in vivo MRI data and microscopic μCT data. Although focused on the breast tumor xenograft vasculature, our imaging platform could be extended to include additional data types for a detailed characterization of the tumor microenvironment and computational systems biology applications.
Figures
Similar articles
-
Multi-modal imaging of angiogenesis in a nude rat model of breast cancer bone metastasis using magnetic resonance imaging, volumetric computed tomography and ultrasound.J Vis Exp. 2012 Aug 14;(66):e4178. doi: 10.3791/4178. J Vis Exp. 2012. PMID: 22929330 Free PMC article.
-
Micro-CT imaging of tumor angiogenesis: quantitative measures describing micromorphology and vascularization.Am J Pathol. 2014 Feb;184(2):431-41. doi: 10.1016/j.ajpath.2013.10.014. Epub 2013 Nov 18. Am J Pathol. 2014. PMID: 24262753 Free PMC article.
-
Multimodal μCT/μMR based semiautomated segmentation of rat vertebrae affected by mixed osteolytic/osteoblastic metastases.Med Phys. 2012 May;39(5):2848-53. doi: 10.1118/1.3703590. Med Phys. 2012. PMID: 22559657
-
Magnetic resonance imaging of tumor vasculature.Thromb Haemost. 2003 Jan;89(1):25-33. Thromb Haemost. 2003. PMID: 12540950 Review.
-
Magnetic resonance imaging of breast cancer angiogenesis: a review.J Exp Clin Cancer Res. 2002 Sep;21(3 Suppl):47-54. J Exp Clin Cancer Res. 2002. PMID: 12585654 Review.
Cited by
-
Tumor Ensemble-Based Modeling and Visualization of Emergent Angiogenic Heterogeneity in Breast Cancer.Sci Rep. 2019 Mar 27;9(1):5276. doi: 10.1038/s41598-019-40888-w. Sci Rep. 2019. PMID: 30918274 Free PMC article.
-
Vascular phenotyping of the invasive front in breast cancer using a 3D angiogenesis atlas.Microvasc Res. 2023 Sep;149:104555. doi: 10.1016/j.mvr.2023.104555. Epub 2023 May 29. Microvasc Res. 2023. PMID: 37257688 Free PMC article.
-
Exploring the diagnostic value of photoacoustic imaging for breast cancer: the identification of regional photoacoustic signal differences of breast tumors.Biomed Opt Express. 2021 Feb 16;12(3):1407-1421. doi: 10.1364/BOE.417056. eCollection 2021 Mar 1. Biomed Opt Express. 2021. PMID: 33796362 Free PMC article.
-
Cross-Modality Imaging of Murine Tumor Vasculature-a Feasibility Study.Mol Imaging Biol. 2021 Dec;23(6):874-893. doi: 10.1007/s11307-021-01615-y. Epub 2021 Jun 8. Mol Imaging Biol. 2021. PMID: 34101107 Free PMC article.
-
MRI reveals the in vivo cellular and vascular response to BEZ235 in ovarian cancer xenografts with different PI3-kinase pathway activity.Br J Cancer. 2015 Feb 3;112(3):504-13. doi: 10.1038/bjc.2014.628. Epub 2014 Dec 23. Br J Cancer. 2015. PMID: 25535727 Free PMC article.
References
-
- Rege A, Thakor NV, Pathak AP. Optical imaging of microvascular morphology and perfusion. Curr Angiogenesis. 2012;1(3):243–260. doi: 10.2174/2211552811201030243. - DOI
Publication types
MeSH terms
Grants and funding
LinkOut - more resources
Full Text Sources
Other Literature Sources
Medical
Miscellaneous
