. 2014 Oct;76(7):2117-35.
doi: 10.3758/s13414-013-0618-7.

"Plateau"-related summary statistics are uninformative for comparing working memory models

Affiliations

"Plateau"-related summary statistics are uninformative for comparing working memory models

Ronald van den Berg et al. Atten Percept Psychophys. 2014 Oct.

Abstract

Performance on visual working memory tasks decreases as more items need to be remembered. Over the past decade, a debate has unfolded between proponents of slot models and slotless models of this phenomenon (Ma, Husain, Bays (Nature Neuroscience 17, 347-356, 2014). Zhang and Luck (Nature 453, (7192), 233-235, 2008) and Anderson, Vogel, and Awh (Attention, Perception, Psychophys 74, (5), 891-910, 2011) noticed that as more items need to be remembered, "memory noise" seems to first increase and then reach a "stable plateau." They argued that three summary statistics characterizing this plateau are consistent with slot models, but not with slotless models. Here, we assess the validity of their methods. We generated synthetic data both from a leading slot model and from a recent slotless model and quantified model evidence using log Bayes factors. We found that the summary statistics provided at most 0.15 % of the expected model evidence in the raw data. In a model recovery analysis, a total of more than a million trials were required to achieve 99 % correct recovery when models were compared on the basis of summary statistics, whereas fewer than 1,000 trials were sufficient when raw data were used. Therefore, at realistic numbers of trials, plateau-related summary statistics are highly unreliable for model comparison. Applying the same analyses to subject data from Anderson et al. (Attention, Perception, Psychophys 74, (5), 891-910, 2011), we found that the evidence in the summary statistics was at most 0.12 % of the evidence in the raw data and far too weak to warrant any conclusions. The evidence in the raw data, in fact, strongly favored the slotless model. These findings call into question claims about working memory that are based on summary statistics.


Figures

Fig. 1
Fig. 1
Trial procedure of a typical delayed-estimation experiment (Wilken & Ma, 2004). Subjects view a set of items and, after a delay, report the value of one item—for instance, by clicking on a color wheel
Fig. 2
Fig. 2
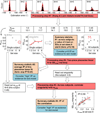
Model comparison methods used by Zhang and Luck (2008) and Anderson et al. (2012). Raw data consist of distributions of estimation errors, one for each set size (top row). Both papers fit a mixture of a uniform distribution and a Von Mises distribution to the raw data (red curves). The mixture model has two parameters: the weight of the Von Mises component (wUVM) and its circular standard deviation (SDUVM). Both papers observe a “plateau” in SDUVM at higher set sizes, and proceed to compare slot and slotless models on the basis of the p value of a t test on differences in SDUVM values between two set sizes. Paper 2 applies further data-processing steps to obtain two more summary statistics that are used for model comparison
Fig. 3
Fig. 3
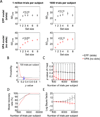
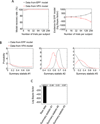
Model comparison using log Bayes factors based on the raw data. a In contrast to the process described in Fig. 2, comparing models using the log Bayes factors based on individual-trial responses is straightforward and does not involve any preprocessing of data. b Using synthetic EPF (black) and VPA (red) data sets consisting of 45 subjects each, the generating models are recovered perfectly even at 16 trials per subject. c The expected log Bayes factor increases monotonically in magnitude with the number of trials per subject. It is consistently positive when the synthetic data are generated from the EPF model (black) and negative when they are generated from the VPA model (red), indicating that the predictions of the models are sufficiently different to allow for an easy distinction. Error bars indicate standard deviations across synthetic data sets
Fig. 4
Fig. 4
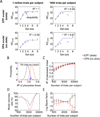
Is summary statistic #1 (p value of t test on SDUVM between set sizes 3 and 4) suitable for model comparison? a SDUVM as a function of set size for four example synthetic data sets (45 subjects each). When the number of trials per subject is large, the EPF model predicts that SDUVM increases for set sizes below memory capacity and is constant for set sizes above capacity (top left). By contrast, the VPA model predicts that SDUVM increases indefinitely (bottom left). A t test between the SDUVM values at set sizes 3 and 4 is significant on the VPA data, but not on the EPF data. However, when the number of trials is of the same order of magnitude as in the empirical data sets (right), the SDUVM estimates become noisy under both models, and a t test does not produce a significant difference in either of these example cases. b Distributions of the p value at 720 trials per subject (the number of trials used in Experiment 1 of paper 2). The distributions largely overlap, indicating that the p value is of little value in distinguishing EPF from VPA data (the blue arrow indicates the p value from Experiment 1 in paper 2). c Mean and 95% confidence interval of the p value as a function of the number of trials. d Model recovery performance based on log Bayes factors computed from summary statistic #1 as a function of the number of trials. Compare with Fig. 3b. e The amount of evidence for the EPF model (log Bayes factor) as a function of the number of trials (mean and standard deviation across synthetic data sets). Compare with Fig. 3c
Fig. 5
Fig. 5
Is summary statistic #2 (R2 of piecewise linear fit to SDUVM versus set size) suitable for model comparison? a SDUVM as a function of set size for four example single-subject synthetic data sets. When the number of trials is large, a piecewise linear function perfectly captures the SDUVM trend in the EPF data (top left) and provides a slightly worse fit in the VPA data (bottom left). However, when the number of trials is of the same order of magnitude as in the empirical data sets (right), the SDUVM estimates become noisy under both models, and the R2 of the piecewise linear function does not seem to be informative about the underlying model. b Distributions of the R2 value at 720 trials per subject (the number of trials used in Experiment 1 of paper 2). The distributions partly overlap, indicating that the R2 value cannot reliably distinguish EPF from VPA data (the blue arrow indicates the R2 value from Experiment 1 in paper 2). c Mean and 95% confidence interval of the R2 value as a function of the number of trials. d Model recovery performance based on log Bayes factors computed from summary statistic #2 as a function of the number of trials. Compare with Fig. 3b. e The amount of evidence for the EPF model (log Bayes factor) as a function of the number of trials (mean and standard deviation across synthetic data sets). Compare with Fig. 3c
Fig. 6
Fig. 6
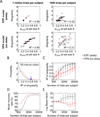
Is summary statistic #3 (R2 of singularity versus wUVM) suitable for model comparison? a Correlation between wUVM at set size 8 and the singularity (IP) of the piecewise linear fit for four example synthetic data sets (45 subjects each). When the number of trials is large, wUVM and IP are near-perfectly correlated in the EPF data (top left). The correlation is slightly lower in the VPA data (bottom left). However, when the number of trials is of the same order of magnitude as in the empirical data sets (right), estimates of wUVM and IP are more noisy, and the correlations much weaker. b Distributions of the R2 value at 720 trials per subject (the number of trials used in Experiment 1 of paper 2). The distributions highly overlap, indicating that the R2 value cannot reliably distinguish EPF from VPA data (the blue arrow indicates the R2 value from Experiment 1 in paper 2). c Mean and 95% confidence interval of the R2 value as a function of the number of trials. d Model recovery performance based on log Bayes factors computed from summary statistic #2 as a function of the number of trials. Compare with Fig. 3b. e The amount of evidence for the EPF model (log Bayes factor) as a function of the number of trials (mean and standard deviation across synthetic data sets). Compare with Fig. 3C
Fig. 7
Fig. 7
Comparison of model evidence and model recovery performance in the raw data and the three summary statistics (ss1, ss2, ss3). a The amount of EPF model evidence (log Bayes factor) in the summary statistics is negligible, as compared with the amount of evidence in the raw data. Detailed plots for each of the summary statistics can be found in Figs. 4c, 5c, and 6c. b Model recovery rate based on summary statistics is low, as compared with that based on raw data
Fig. 8
Fig. 8
Model evidence and fits to subject data from Experiment 1 of paper 2. a Model evidence computed from the subject data of Experiment 1 in paper 2. Model evidence derived from the summary statistic is negligible, as compared with the evidence provided by the raw data. b Left: Maximum-likelihood fits to error histograms (“raw data”). Model predictions were obtained by simulating 50,000 trials per set size per subject, with parameter values set to the subject’s maximum-likelihood estimates. Subject data and model predictions are collapsed across set sizes and subjects. Right: Model residuals (data minus fit) averaged across subjects and set sizes (180 bins, smoothed using a sliding window with a width of 4 bins). The EPF model shows a clear peak at the center, indicating that the empirical distribution of the estimation error is narrower than the fitted distribution. The residual of the VPA model is smaller, consistent with the finding shown in panel a that this model provides a better fit to the raw data than does the EPF model. c Maximum-likelihood fits to summary statistics. The EPF and VPA models fit all three summary statistics approximately equally well. Error bars indicate 95% confidence intervals
Fig. 9
Fig. 9
Effect of the prior distribution over parameters on model comparison using raw data. When computing expected log Bayes factors, a prior distribution over parameter values is used at two places: when generating synthetic data and when marginalizing over parameters to compute the log Bayes factor for a single synthetic subject. a Same as Figs. 3b and 3c, except that both the generating and marginalization prior distribution were uniform distributions instead of a bivariate Gaussian derived from empirical values. b Predicted distributions of the summary statistics under the uniform prior distributions (cf. Figs. 4b, 5b, 6b). c Model evidence obtained from subject data under the uniform prior distributions (cf. Fig. 8a)
Fig. 10
Fig. 10
Effect of the using the “wrong” prior distribution in the marginalization step when computing log Bayes factors from raw data. a Same as Fig. 3b, except that the prior distribution used in the marginalization step was a uniform distribution instead of the bivariate Gaussian derived from empirical values. b Same as Fig. 3c, except that the prior distribution used in the marginalization step was a uniform distribution, instead of the bivariate Gaussian derived from empirical values
Figure A1
Figure A1. Prior distributions on parameter values in the EPF (left) and VPA (right) models
Both distributions are bivariate normal distributions. To ensure that synthetic data had approximately the same statistics as subject data, we set the mean and covariance of these distributions equal to the mean and covariance of the maximum-likelihood estimates of the subject data of Experiment 1 in Paper 2. Samples of parameter K in the EPF model were rounded to the nearest integer value. These prior distributions were used in two places: (1) to draw parameter values when generating synthetic data and (2) to sample parameter values when approximating marginal model likelihoods.
Figure A3
Figure A3. Effect of number of samples drawn from the prior distribution over parameters when computing expected log Bayes factors
Computation of expected log Bayes factors involves an integration over the parameter prior. In the main analyses, we performed this integration numerically by drawing 500 Monte Carlo samples from the prior distribution over parameters. To check whether 500 is sufficient to obtain stable and unbiased estimates, we computed the log Bayes factor as a function of the number of samples (averages and standard errors over 100 runs with 1 synthetic subject with 720 trials distributed across set sizes 1,2,3,4,6, and 8). When the number of samples is small, the log Bayes factor is unstable (large error bars) and biased (systematically lower than the asymptote). However, it converges at around 16 samples, which indicates that 500 was sufficient to obtain stable and unbiased results.

Similar articles

Cited by

References

    1. Akaike H. A new look at the statistical model identification. IEEE Transactions on Automatic Control. 1974;19(6):716–723.
    1. Alvarez GA, Cavanagh P. The capacity of visual short-term memory is set both by visual information load and by number of objects. Psych Science. 2004;15:106–111. - PubMed
    1. Anderson DE, Awh E. The plateau in mnemonic resolution across large set sizes indicates discrete resource limits in visual working memory. Atten Percept Psychophys. 2012;74(5):891–910. - PMC - PubMed
    1. Anderson DE, Vogel EK, Awh E. Precision in visual working memory reaches a stable plateau when individual item limits are exceeded. J Neurosci. 2011;31(3):1128–1138. - PMC - PubMed
    1. Anderson DE, Vogel EK, Awh E. Selection and storage of perceptual groups is constrained by a discrete resource in working memory. J Exp Psych Hum Percept Perform. 2013;39(3):824–835. - PMC - PubMed

LinkOut - more resources