

Riding the spermatogenic wave: profiling gene expression within neonatal germ and sertoli cells during a synchronized initial wave of spermatogenesis in mice
- PMID: 24719255
- PMCID: PMC4076369
- DOI: 10.1095/biolreprod.114.118034
Riding the spermatogenic wave: profiling gene expression within neonatal germ and sertoli cells during a synchronized initial wave of spermatogenesis in mice
Abstract
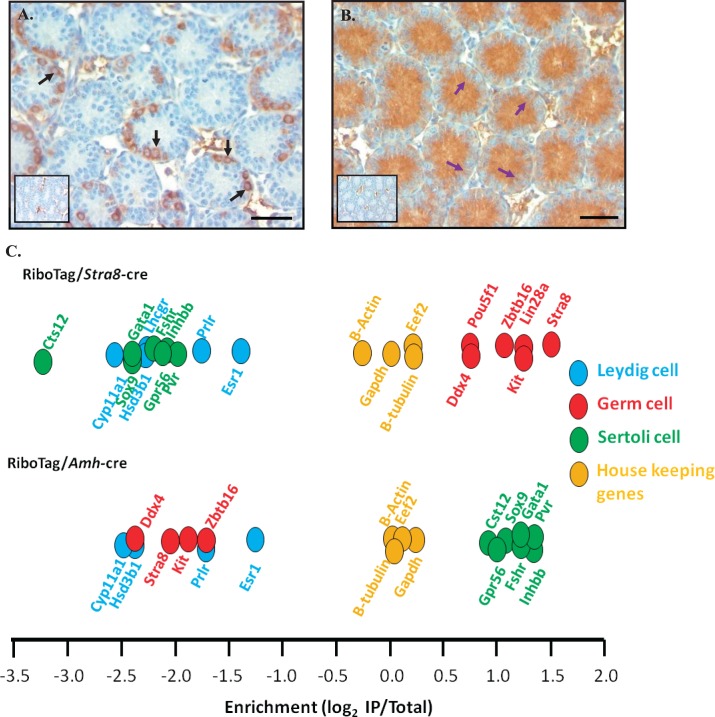
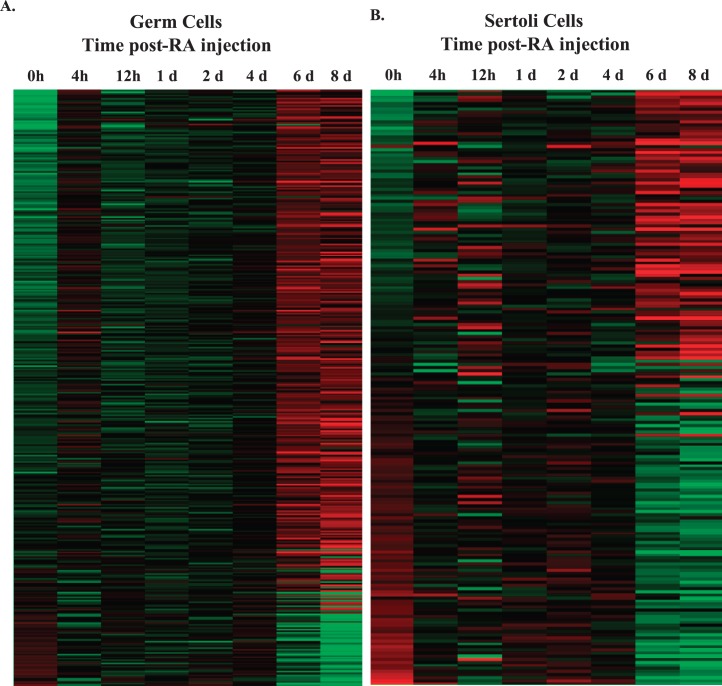
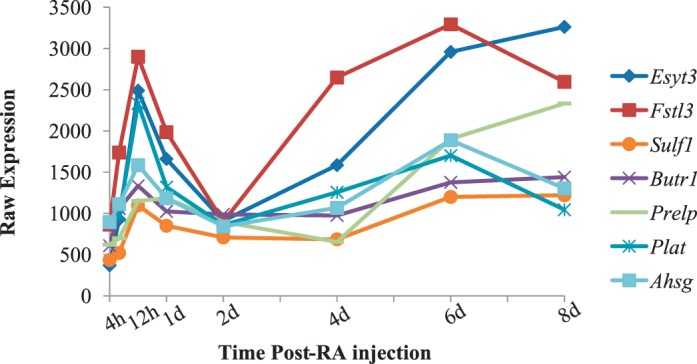
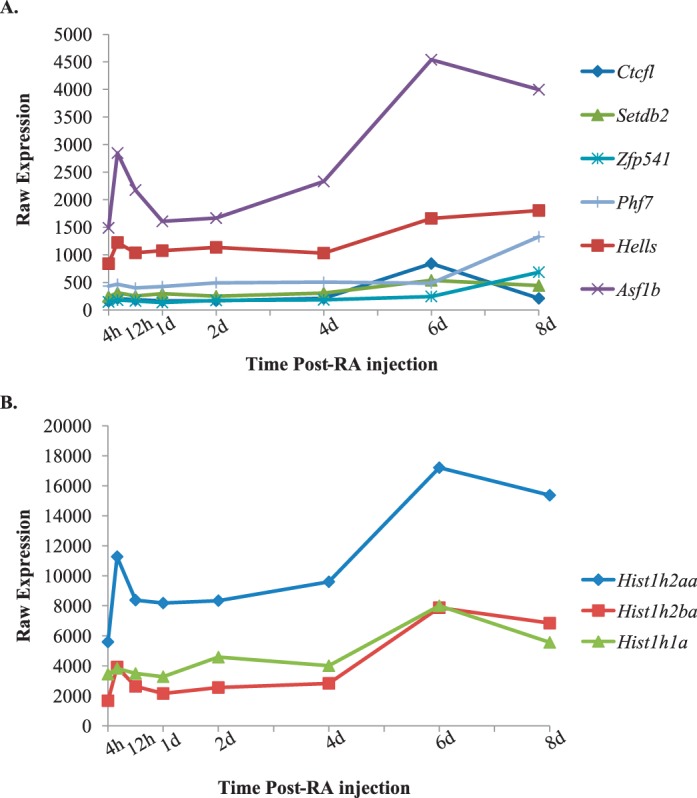
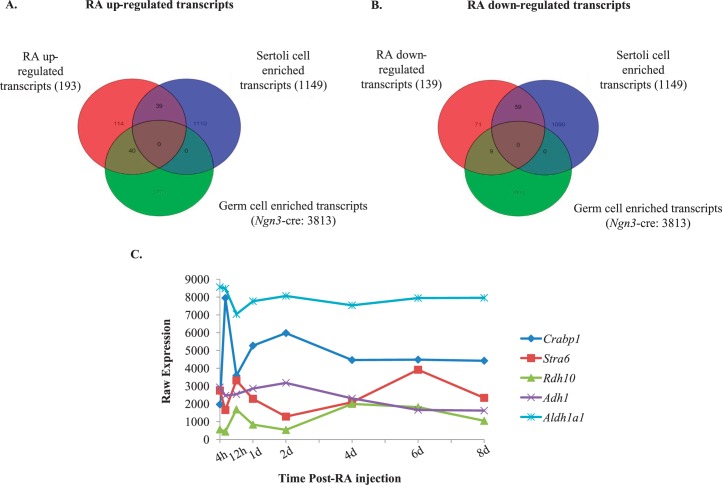
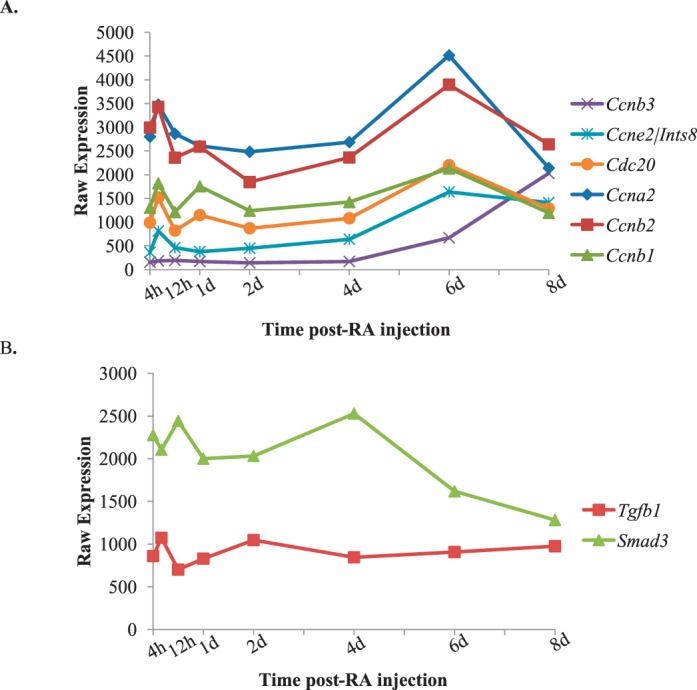
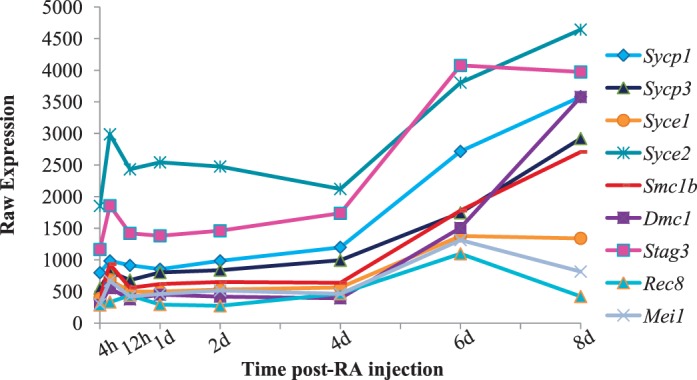
Continual sperm production relies on germ cells undergoing spermatogenesis asynchronously. As a result, the testis always contains a mixed population of germ cells at different stages of their differentiation process. The heterogeneous nature of the testis makes profiling gene expression within Sertoli cells or specific populations of germ cells impossible when a wild-type testis is assessed. We recently reported a unique method for synchronizing spermatogenesis without affecting fertility by manipulating RA levels within the neonatal testis. Using this protocol, combined with the RiboTag transgenic mouse line, we have mapped the Sertoli and germ cell translatome during the initial synchronized wave of spermatogenesis. Using microarray analysis, we identified 392 and 194 germ cell and Sertoli cells transcripts, respectively, that dynamically change during spermatogonial differentiation, division, and the onset of meiosis. Functional annotation clustering revealed that transcripts enriched in germ cells were mostly associated with meiosis (21 transcripts), chromatin organization (12 transcripts), and cell cycle (3 transcripts). In addition, glycoproteins (65 transcripts), cell adhesion (15 transcripts), and cell junction (13 transcripts) transcripts were overrepresented in the Sertoli cell-enriched list. These datasets represent the first transcriptional analysis of spermatogonial differentiation, division, and meiotic onset. These data suggest that several of the genes encoding meiotic proteins are expressed and are actively being translated well before germ cells enter meiosis. In addition, this study provides novel candidate genes, Asf1b and Esyt3, that may be involved in the regulation of spermatogonial chromatin reorganization, germ-Sertoli cell interactions, and/or blood-testis barrier formation.
Keywords: Sertoli cells; gene expression; germ cells; retinoic acid; retinoids; spermatogonia; testis; translational profiling.
© 2014 by the Society for the Study of Reproduction, Inc.
Figures

Similar articles
-
Characterizing the Spermatogonial Response to Retinoic Acid During the Onset of Spermatogenesis and Following Synchronization in the Neonatal Mouse Testis.Biol Reprod. 2016 Oct;95(4):81. doi: 10.1095/biolreprod.116.141770. Epub 2016 Aug 3. Biol Reprod. 2016. PMID: 27488029 Free PMC article.
-
Fold-change correction values for testicular somatic transcripts in gene expression studies of human spermatogenesis.Hum Reprod. 2013 Mar;28(3):590-8. doi: 10.1093/humrep/des433. Epub 2013 Jan 9. Hum Reprod. 2013. PMID: 23303554
-
Expression of stimulated by retinoic acid gene 8 (Stra8) and maturation of murine gonocytes and spermatogonia induced by retinoic acid in vitro.Biol Reprod. 2008 Mar;78(3):537-45. doi: 10.1095/biolreprod.107.064337. Epub 2007 Nov 21. Biol Reprod. 2008. PMID: 18032419 Free PMC article.
-
Cell-cell interactions in the testis of teleosts and elasmobranchs.Microsc Res Tech. 1995 Dec 15;32(6):533-52. doi: 10.1002/jemt.1070320606. Microsc Res Tech. 1995. PMID: 8605400 Review.
-
50 years of spermatogenesis: Sertoli cells and their interactions with germ cells.Biol Reprod. 2018 Jul 1;99(1):87-100. doi: 10.1093/biolre/ioy027. Biol Reprod. 2018. PMID: 29462262 Free PMC article. Review.
Cited by
-
Cycles, waves, and pulses: Retinoic acid and the organization of spermatogenesis.Andrology. 2020 Jul;8(4):892-897. doi: 10.1111/andr.12722. Epub 2019 Nov 20. Andrology. 2020. PMID: 31670467 Free PMC article. Review.
-
Metabolic Requirements for Spermatogonial Stem Cell Establishment and Maintenance In Vivo and In Vitro.Int J Mol Sci. 2021 Feb 18;22(4):1998. doi: 10.3390/ijms22041998. Int J Mol Sci. 2021. PMID: 33670439 Free PMC article. Review.
-
Characterizing the Spermatogonial Response to Retinoic Acid During the Onset of Spermatogenesis and Following Synchronization in the Neonatal Mouse Testis.Biol Reprod. 2016 Oct;95(4):81. doi: 10.1095/biolreprod.116.141770. Epub 2016 Aug 3. Biol Reprod. 2016. PMID: 27488029 Free PMC article.
-
Cell cycle regulation for meiosis in mammalian germ cells.J Reprod Dev. 2023 Jun 6;69(3):139-146. doi: 10.1262/jrd.2023-010. Epub 2023 Mar 17. J Reprod Dev. 2023. PMID: 36927827 Free PMC article. Review.
-
Post-Testicular Sperm Maturation: Centriole Pairs, Found in Upper Epididymis, are Destroyed Prior to Sperm's Release at Ejaculation.Sci Rep. 2016 Aug 18;6:31816. doi: 10.1038/srep31816. Sci Rep. 2016. PMID: 27534805 Free PMC article.
References
-
- Nebel BR, Amarose AP, Hacket EM. Calendar of gametogenic development in the prepuberal male mouse. Science 1961; 134: 832–833. - PubMed
-
- McCarrey J. Cell and Molecular Biology of the Testis. New York: Oxford University Press; 1993: 58–89.
-
- Drumond AL, Meistrich ML, Chiarini-Garcia H. Spermatogonial morphology and kinetics during testis development in mice: a high-resolution light microscopy approach. Reproduction 2011; 142: 145–155. - PubMed
-
- Yoshida S, Takakura A, Ohbo K, Abe K, Wakabayashi J, Yamamoto M, Suda T, Nabeshima Y. Neurogenin3 delineates the earliest stages of spermatogenesis in the mouse testis. Dev Biol 2004; 269: 447–458. - PubMed
Publication types
MeSH terms
Substances
Grants and funding
LinkOut - more resources
Full Text Sources
Other Literature Sources
Molecular Biology Databases
Research Materials
Miscellaneous
