. 2014 Jun 6;289(23):16421-9.
doi: 10.1074/jbc.M114.569996. Epub 2014 Apr 9.

Inhibition of the cardiac Na⁺ channel Nav1.5 by carbon monoxide

Affiliations

Inhibition of the cardiac Na⁺ channel Nav1.5 by carbon monoxide

Jacobo Elies et al. J Biol Chem. .

Abstract

Sublethal carbon monoxide (CO) exposure is frequently associated with myocardial arrhythmias, and our recent studies have demonstrated that these may be attributable to modulation of cardiac Na(+) channels, causing an increase in the late current and an inhibition of the peak current. Using a recombinant expression system, we demonstrate that CO inhibits peak human Nav1.5 current amplitude without activation of the late Na(+) current observed in native tissue. Inhibition was associated with a hyperpolarizing shift in the steady-state inactivation properties of the channels and was unaffected by modification of channel gating induced by anemone toxin (rATX-II). Systematic pharmacological assessment indicated that no recognized CO-sensitive intracellular signaling pathways appeared to mediate CO inhibition of Nav1.5. Inhibition was, however, markedly suppressed by inhibition of NO formation, but NO donors did not mimic or occlude channel inhibition by CO, indicating that NO alone did not account for the actions of CO. Exposure of cells to DTT immediately before CO exposure also dramatically reduced the magnitude of current inhibition. Similarly, l-cysteine and N-ethylmaleimide significantly attenuated the inhibition caused by CO. In the presence of DTT and the NO inhibitor N(ω)-nitro-L-arginine methyl ester hydrochloride, the ability of CO to inhibit Nav1.5 was almost fully prevented. Our data indicate that inhibition of peak Na(+) current (which can lead to Brugada syndrome-like arrhythmias) occurs via a mechanism distinct from induction of the late current, requires NO formation, and is dependent on channel redox state.

Keywords: Arrhythmia; Carbon Monoxide; Heart; Nitric Oxide; Patch Clamp Electrophysiology; Sodium Channels.


Figures

FIGURE 1.
FIGURE 1.
CO inhibits recombinant human Nav1.5 channels expressed in HEK293 cells. A, shown are families of currents evoked by step depolarizations applied from a holding potential of −100 mV to between −70 mV and +40 mV before (control) during (CORM-2) and after a 3-min washout of the CO donor CORM-2 (3 μm). Shown below is a time series plot in which each open plotted point is the measured peak amplitude of current evoked by successive step depolarizations from −100 mV to −30 mV. For the period indicated by the horizontal bar, the cell was exposed to 3 μm CORM-2. The solid symbols show the amplitude of the late current measured in the same cell. Gaps in the time series represent brief periods when current voltage relationships were recorded. B, mean ± S.E. (error bars) current density versus voltage plots determined in control cells (●; n = 7), cells exposed to 3 μm CORM-2 (○; n = 7), and cells exposed to 3 μm iCORM (□; n = 7). Effects of CORM were statistically significant (p < 0.02 to p < 0.0001) over the voltage range −40 to +40 mV. Inset plots show normalized current activation curves under control conditions (●; n = 7) and in the presence of 3 μm CORM-2 (○; n = 7). C, concentration response relationship indicating the potency of CORM-2 to inhibit Nav1.5 currents. Each point plotted is the mean ± S.E. (error bars) inhibition of current determined from seven cells in each case. The fitted curve revealed an IC50 value of 1.38 μm. D, bar graph showing mean ± S.E. (error bars) (n = 9 cells in each case) inhibition caused by solvent (dimethyl sulfoxide (DMSO); 0.1%), iCORM, CORM-2, and CO dissolved directly into solution. ***, p < 0.0001 versus control. E, steady-state inactivation curves determined in four cells before and during exposure to 3 μm CORM-2. Each point represents mean ± S.E. (error bars), and curves were fitted by Boltzmann equations. Effects of CORM were statistically significant (p < 0.01, p < 0.001) over the voltage range of −100 to −80 mV.
FIGURE 2.
FIGURE 2.
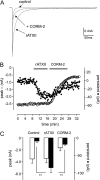
CO inhibits the ATX-II induced late Nav1.5 current. A, shown are currents evoked in a Nav1.5-expressing HEK293 cell under control conditions, during exposure to 50 nm rATXII, and during exposure to 3 μm CORM-2 following rATXII exposure, as indicated. Currents were evoked by step depolarizations from −100 to −30 mV. B, shown is a time series plot in which each open plotted point is the peak amplitude of current evoked by successive step depolarizations from −100 to −30 mV (measured 200 ms into pulse duration). For the periods indicated by the horizontal bar, the cell was exposed to 50 nm rATXII and then to 3 μm CORM-2. The solid symbols show the amplitude of the late current measured in the same cell. C, bar graph plotting mean ± S.E. (n = 5 cells) peak (open bars) and late (solid bars) current amplitudes under control conditions and in the presence of 50 nm rATXII and then 3 μm CORM-2, as indicated. **, p < 0.01.
FIGURE 3.
FIGURE 3.
CO inhibits Nav1.5 without involvement of numerous known signaling pathways. Bar graphs show the effects of various agents that interfere with the ability of CO (applied as CORM-2, 3 μm) to reduce the peak Na+ current amplitude. In each case, mean effects of CORM-2 were determined from the number of cells (indicated in parentheses). Dashed lines indicate the mean effects of CORM-2 applied alone (i.e. in the absence of other agents; 71.1 ± 0.48% inhibition, n = 15)). Agents investigated were designed to probe the involvement of mitochondria. A, 2 μm rotenone (Rot.), 1 μm stigmatellin (stigm.; 30 min preincubation), and 3 μm antimycin A. B, xanthine oxidase and NADPH oxidase (1 μm allopurinol (30-min preincubation), and 3 μm diphenyleneiodonium chloride (DPI)); C, antioxidants (400 μm trolox; 500 μm ascorbic acid; 100 μm MnTMPyP, and 1 μm ebselen (30-min pre-incubation), 3 mm glutathione (GSH), and 250 nm mitoQ); D, cGMP/PKG pathway (30 μm 1H-[1,2,4]oxadiazolo[4,3-a]quinoxalin-1-one (ODQ), 0.5 μm Sp-8-Br-cGMPS, and 0.5 μm Rp-8-Br-PET-cGMPS (1-h preincubation for these three drugs)); E, involvement of other kinases (1 μm KN-93, and 10 μm SB-203580 (1-h preincubation for both drugs)).
FIGURE 4.
FIGURE 4.
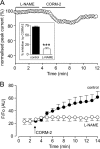
CO inhibition of Nav1.5 involves NO formation. A, shown is a time series plot in which each plotted point is the peak amplitude of current evoked by successive step depolarizations from −100 to −30 mV. For the periods indicated by the horizontal bars, the cell was exposed to 1 mm l-NAME and then to 3 μm CORM-2. Inset, bar graph showing the mean ± S.E. effects of 3 μm CORM-2 alone (n = 10), or following pretreatment with l-NAME (n = 10). ***, p < 0.0001. B, DAF-2 fluorescence measured in HEK293 cells overexpressing Nav1.5. At the point indicated by the arrow, cells were exposed to 3 μm CORM-2. Mean ± S.E. fluorescence (plotted as arbitrary units, AU) is shown for naive cells (solid circles) or cells pretreated with 1 mm l-NAME (open circles; n = 5 in each case). Fluorescence was statistically significantly different between the two groups at t = 9 min and later (p < 0.05 to p < 0.001).
FIGURE 5.
FIGURE 5.
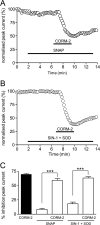
NO donors do not mimic CO. A, shown is a time series plot showing the measured peak current amplitude evoked by successive step depolarizations from −100 to −30 mV. For the periods indicated by the horizontal bars, the cell was exposed to 200 μm (S)-nitroso-N-acetylpenicillamine and to 3 μm CORM-2, as indicated. B, as in A, except that the cell was exposed to 100 μm SIN-1 plus superoxide dismutase (SOD; 50 units/ml) rather than (S)-nitroso-N-acetylpenicillamine (SNAP). C, bar graph showing mean ± S.E. inhibition of peak Na+ current (measured as in A and B) caused by 3 μm CORM-2 applied alone (solid bar) or together with the NO donors as used in A and B, and the effects of the donors alone (n = 5 cells in each case). ***, p < 0.0001.
FIGURE 6.
FIGURE 6.
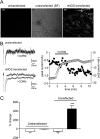
Co-expression of nNOS permits CO-induction of the late Na+ current. A, immunofluorescent (left) and bright field (BF; center) images of Nav1.5-expressing HEK293 cells without co-expression of nNOS. Right image shows immunofluorescence staining for nNOS in cells transiently transfected with nNOS and eGFP on the pIRES-EGFP-puro plasmid. Scale bars represent 10 μm in each case. B, left, shown are currents evoked in a non-transfected cell (upper traces) and a nNOS-transfected cell (lower traces) before and during exposure to 3 μm CORM-2, as indicated. Currents evoked in each case by step depolarizations from −100 to −30 mV. Right, shown is a time series plot showing the measured peak (open symbols) and late (solid symbols) current amplitudes evoked by successive step depolarizations from −100 to −30 mV. For the period indicated by the horizontal bar, the cell was exposed to 3 μm CORM-2, as indicated. The cell underwent transfection with nNOS and demonstrates the late current enhancement by CO exposure only seen in these transfected cells. C, bar graph showing mean ± S.E. effects of 3 μm CORM-2 on peak Na+ current (open bars) and late current (solid bars) caused by applied to untransfected cells (n = 5) and nNOS-transfected cells (n = 6). **, p < 0.01; ***, p < 0.0001.
FIGURE 7.
FIGURE 7.
Cysteine-modulating agents influence Nav1.5 inhibition by CO. A, shown is a time series plot showing the measured peak current amplitude evoked by successive step depolarizations from −100 to −30 mV. For the periods indicated by the horizontal bars, the cell was exposed to 1 mm DTT and then to 3 μm CORM-2, as indicated. B, as described in A, except that the cell was dialyzed with 300 μm N-ethylmaleimide (NEM) rather than exposed to DTT. C, as described in A except that the cell was exposed to 100 μm l-cysteine (L-Cys) rather than DTT. D, bar graph showing mean ± S.E. inhibition of peak Na+ current (measured as in A–C) caused by 3 μm CORM-2 applied alone (solid bar) or together with the cysteine modifying agents used in A–C, and the effects of the donors alone (n = 10 for DTT, n = 9 for N-ethylmaleimide, and n = 8 for l-Cys). ***, p < 0.0001; **, p < 0.005. E, time series plot as in A–C, except that the cells were exposed to 1 mm l-NAME together with 1 mm DTT before exposure to 3 μm CORM-2. F, bar graph showing mean ± S.E. inhibition of peak Na+ current (measured as in A–C) caused by 3 μm CORM-2 applied alone (solid bar) of after treatment with 1 mm l-NAME alone (from Fig. 4) or together with DTT (n = 10 cells). ***, p < 0.0001.

Similar articles

Cited by

References

    1. Wu L., Wang R. (2005) Carbon monoxide: endogenous production, physiological functions, and pharmacological applications. Pharmacol. Rev. 57, 585–630 - PubMed
    1. Kim H. P., Ryter S. W., Choi A. M. (2006) CO as a cellular signaling molecule. Annu. Rev. Pharmacol. Toxicol. 46, 411–449 - PubMed
    1. Ryter S. W., Alam J., Choi A. M. (2006) Heme oxygenase-1/carbon monoxide: from basic science to therapeutic applications. Physiol. Rev. 86, 583–650 - PubMed
    1. Durante W., Johnson F. K., Johnson R. A. (2006) Role of carbon monoxide in cardiovascular function. J. Cell Mol. Med. 10, 672–686 - PMC - PubMed
    1. Lakkisto P., Palojoki E., Bäcklund T., Saraste A., Tikkanen I., Voipio-Pulkki L. M., Pulkki K. (2002) Expression of heme oxygenase-1 in response to myocardial infarction in rats. J. Mol. Cell Cardiol. 34, 1357–1365 - PubMed

Publication types

Substances