

Transcription of the herpes simplex virus 1 genome during productive and quiescent infection of neuronal and nonneuronal cells
- PMID: 24719411
- PMCID: PMC4054390
- DOI: 10.1128/JVI.00516-14
Transcription of the herpes simplex virus 1 genome during productive and quiescent infection of neuronal and nonneuronal cells
Abstract
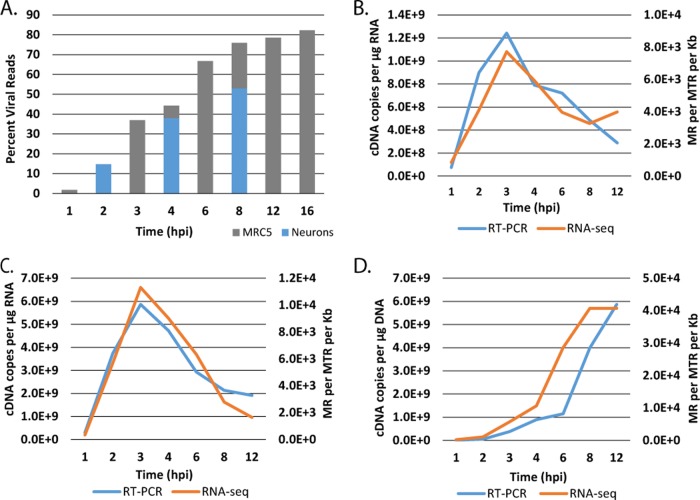
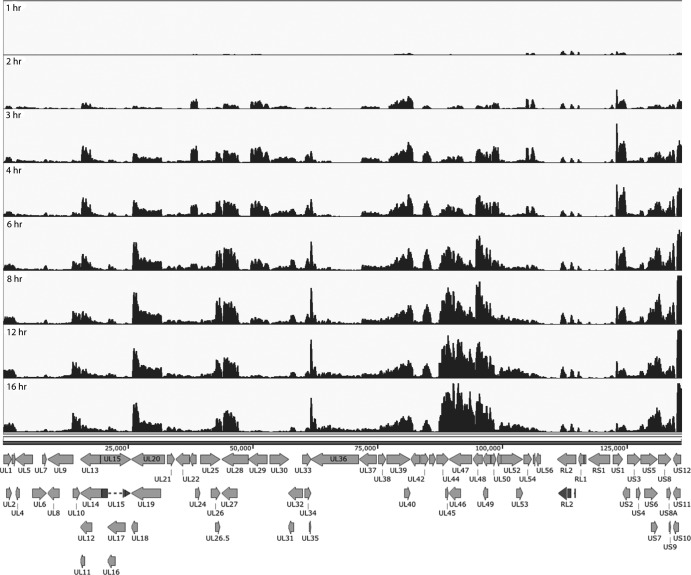
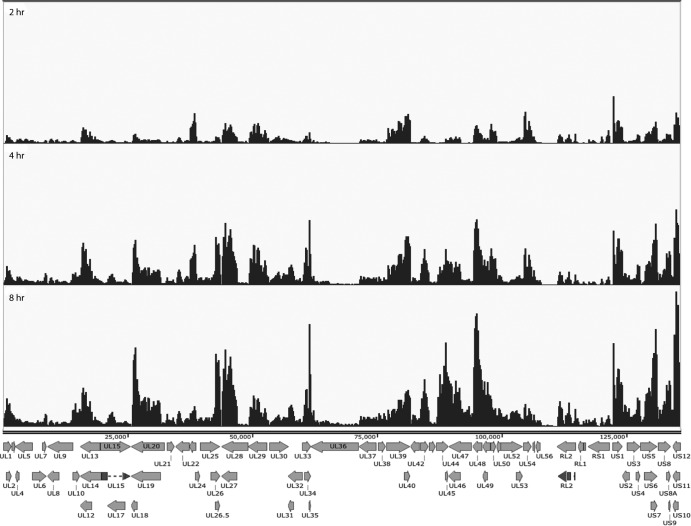
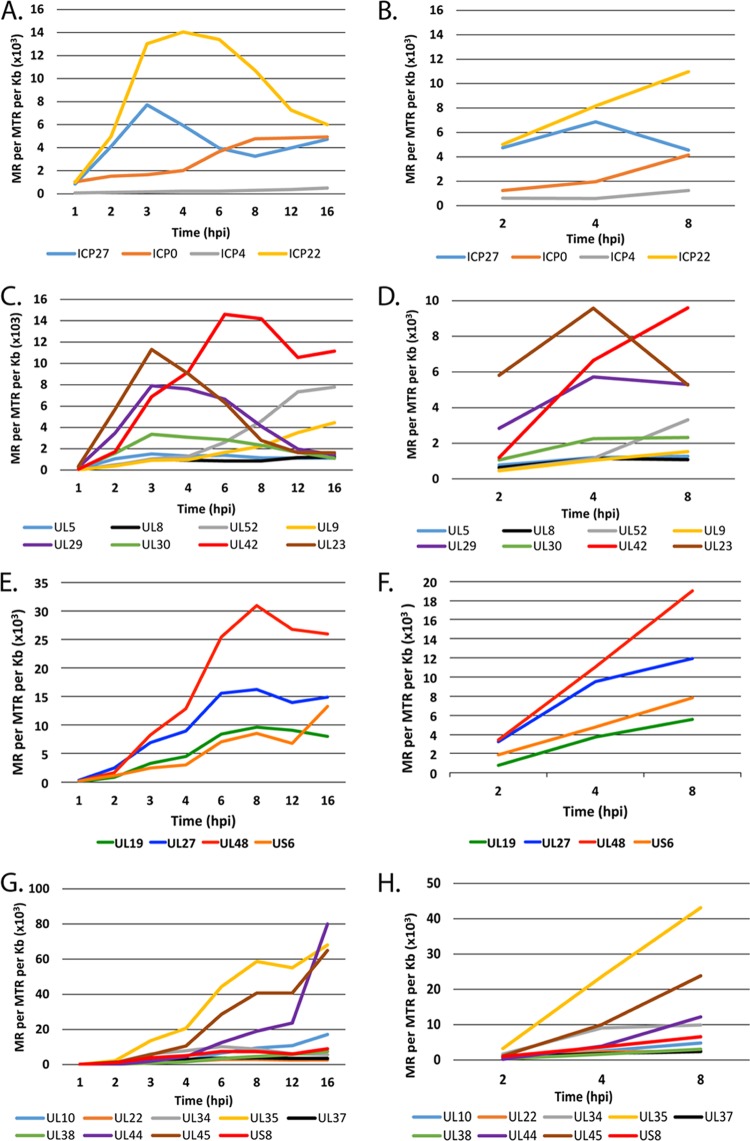
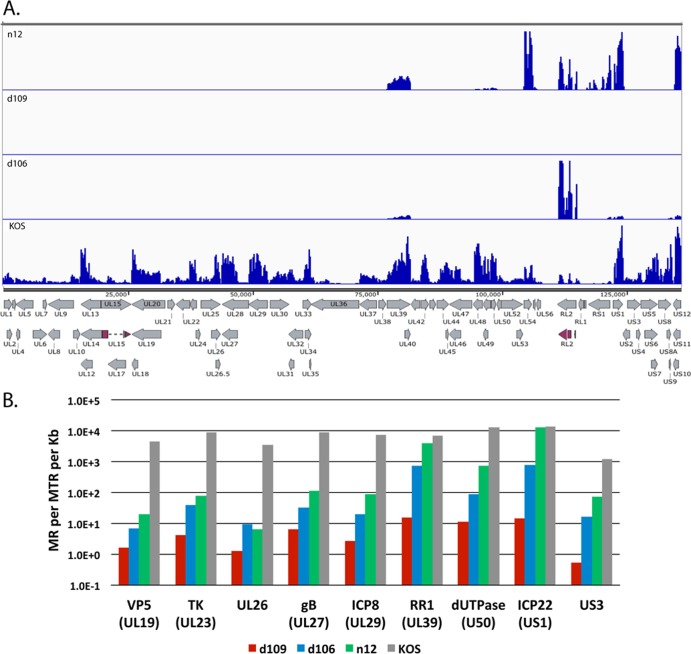
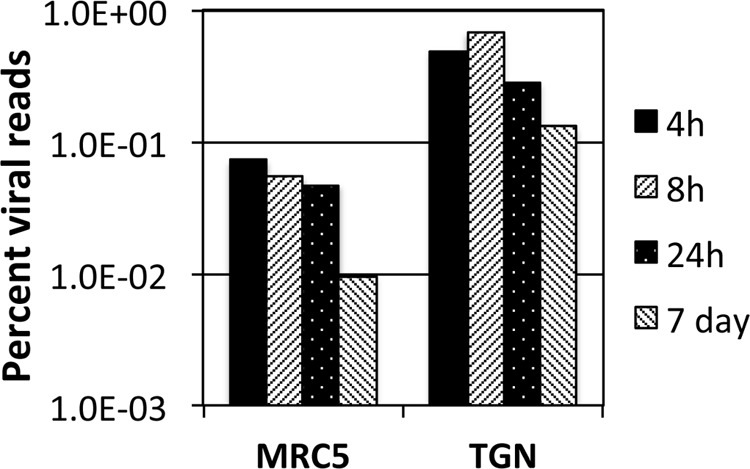
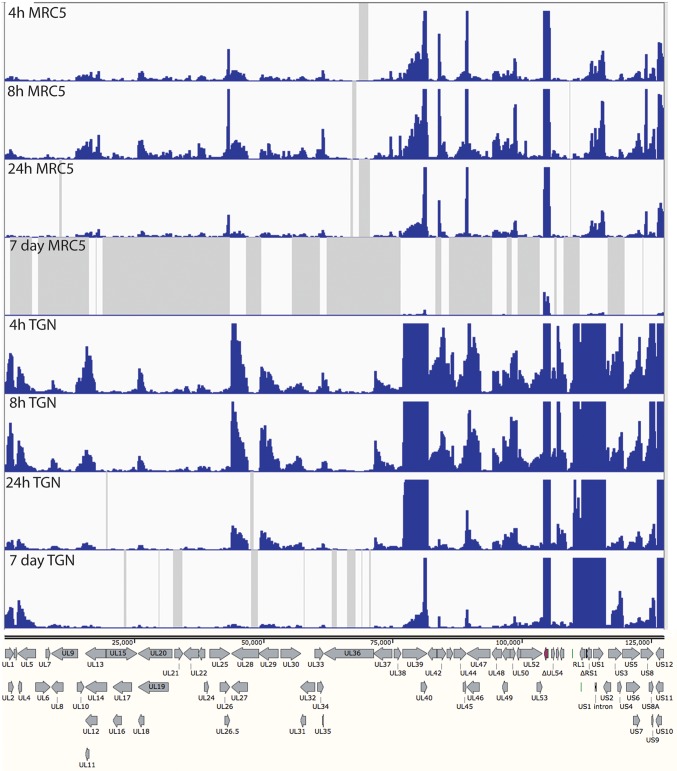
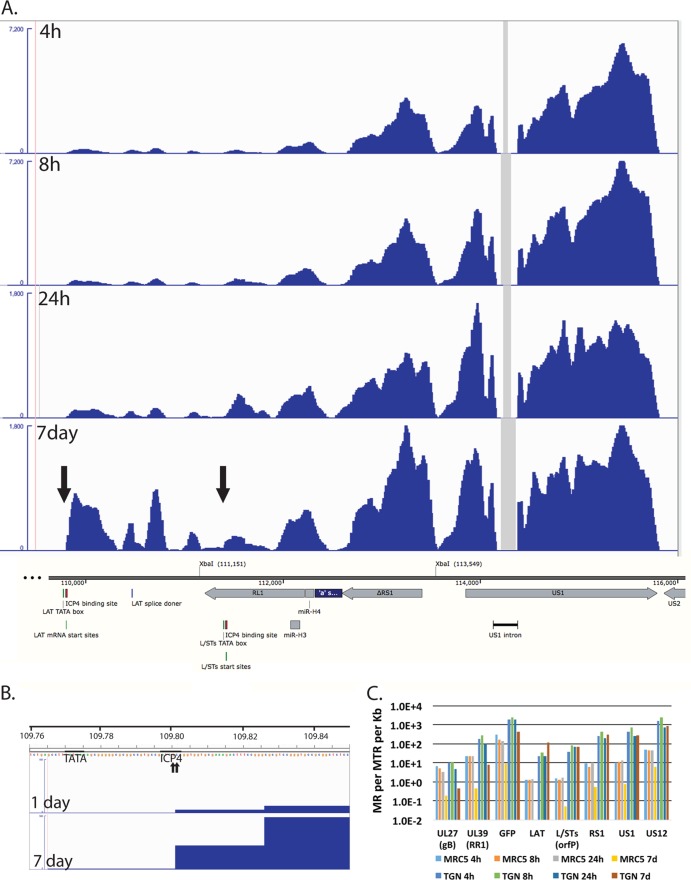
Herpes simplex virus 1 (HSV-1) can undergo a productive infection in nonneuronal and neuronal cells such that the genes of the virus are transcribed in an ordered cascade. HSV-1 can also establish a more quiescent or latent infection in peripheral neurons, where gene expression is substantially reduced relative to that in productive infection. HSV mutants defective in multiple immediate early (IE) gene functions are highly defective for later gene expression and model some aspects of latency in vivo. We compared the expression of wild-type (wt) virus and IE gene mutants in nonneuronal cells (MRC5) and adult murine trigeminal ganglion (TG) neurons using the Illumina platform for cDNA sequencing (RNA-seq). RNA-seq analysis of wild-type virus revealed that expression of the genome mostly followed the previously established kinetics, validating the method, while highlighting variations in gene expression within individual kinetic classes. The accumulation of immediate early transcripts differed between MRC5 cells and neurons, with a greater abundance in neurons. Analysis of a mutant defective in all five IE genes (d109) showed dysregulated genome-wide low-level transcription that was more highly attenuated in MRC5 cells than in TG neurons. Furthermore, a subset of genes in d109 was more abundantly expressed over time in neurons. While the majority of the viral genome became relatively quiescent, the latency-associated transcript was specifically upregulated. Unexpectedly, other genes within repeat regions of the genome, as well as the unique genes just adjacent the repeat regions, also remained relatively active in neurons. The relative permissiveness of TG neurons to viral gene expression near the joint region is likely significant during the establishment and reactivation of latency.
Importance: During productive infection, the genes of HSV-1 are transcribed in an ordered cascade. HSV can also establish a more quiescent or latent infection in peripheral neurons. HSV mutants defective in multiple immediate early (IE) genes establish a quiescent infection that models aspects of latency in vivo. We simultaneously quantified the expression of all the HSV genes in nonneuronal and neuronal cells by RNA-seq analysis. The results for productive infection shed further light on the nature of genes and promoters of different kinetic classes. In quiescent infection, there was greater transcription across the genome in neurons than in nonneuronal cells. In particular, the transcription of the latency-associated transcript (LAT), IE genes, and genes in the unique regions adjacent to the repeats persisted in neurons. The relative activity of this region of the genome in the absence of viral activators suggests a more dynamic state for quiescent genomes persisting in neurons.
Copyright © 2014, American Society for Microbiology. All Rights Reserved.
Figures
Similar articles
-
Relaxed repression of herpes simplex virus type 1 genomes in Murine trigeminal neurons.J Virol. 2007 Nov;81(22):12394-405. doi: 10.1128/JVI.01068-07. Epub 2007 Sep 12. J Virol. 2007. PMID: 17855552 Free PMC article.
-
A5-positive primary sensory neurons are nonpermissive for productive infection with herpes simplex virus 1 in vitro.J Virol. 2011 Jul;85(13):6669-77. doi: 10.1128/JVI.00204-11. Epub 2011 Apr 20. J Virol. 2011. PMID: 21507969 Free PMC article.
-
Increased neurovirulence and reactivation of the herpes simplex virus type 1 latency-associated transcript (LAT)-negative mutant dLAT2903 with a disrupted LAT miR-H2.J Neurovirol. 2016 Feb;22(1):38-49. doi: 10.1007/s13365-015-0362-y. Epub 2015 Jun 12. J Neurovirol. 2016. PMID: 26069184 Free PMC article.
-
Early expression of herpes simplex virus (HSV) proteins and reactivation of latent infection.Folia Microbiol (Praha). 2000;45(1):7-28. doi: 10.1007/BF02817445. Folia Microbiol (Praha). 2000. PMID: 11200675 Review.
-
A comparison of herpes simplex virus type 1 and varicella-zoster virus latency and reactivation.J Gen Virol. 2015 Jul;96(Pt 7):1581-602. doi: 10.1099/vir.0.000128. Epub 2015 Mar 20. J Gen Virol. 2015. PMID: 25794504 Free PMC article. Review.
Cited by
-
Cell Intrinsic Determinants of Alpha Herpesvirus Latency and Pathogenesis in the Nervous System.Viruses. 2023 Nov 22;15(12):2284. doi: 10.3390/v15122284. Viruses. 2023. PMID: 38140525 Free PMC article. Review.
-
Human Herpes Simplex Virus-1 depletes APOBEC3A from nuclei.Virology. 2019 Nov;537:104-109. doi: 10.1016/j.virol.2019.08.012. Epub 2019 Aug 13. Virology. 2019. PMID: 31493648 Free PMC article.
-
Cellular Antisilencing Elements Support Transgene Expression from Herpes Simplex Virus Vectors in the Absence of Immediate Early Gene Expression.J Virol. 2018 Aug 16;92(17):e00536-18. doi: 10.1128/JVI.00536-18. Print 2018 Sep 1. J Virol. 2018. PMID: 29950408 Free PMC article.
-
Restriction of Replication of Oncolytic Herpes Simplex Virus with a Deletion of γ34.5 in Glioblastoma Stem-Like Cells.J Virol. 2018 Jul 17;92(15):e00246-18. doi: 10.1128/JVI.00246-18. Print 2018 Aug 1. J Virol. 2018. PMID: 29793956 Free PMC article.
-
Engineered HSV vector achieves safe long-term transgene expression in the central nervous system.Sci Rep. 2017 May 4;7(1):1507. doi: 10.1038/s41598-017-01635-1. Sci Rep. 2017. PMID: 28473703 Free PMC article.
References
Publication types
MeSH terms
Substances
Grants and funding
LinkOut - more resources
Full Text Sources
Other Literature Sources
Medical
Research Materials
Miscellaneous
