Establishment of a swine model for validation of perfusion measurement by dynamic contrast-enhanced magnetic resonance imaging
- PMID: 24719859
- PMCID: PMC3955654
- DOI: 10.1155/2014/390506
Establishment of a swine model for validation of perfusion measurement by dynamic contrast-enhanced magnetic resonance imaging
Abstract
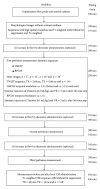
The aim of the study was to develop a suitable animal model for validating dynamic contrast-enhanced magnetic resonance imaging perfusion measurements. A total of 8 pigs were investigated by DCE-MRI. Perfusion was determined on the hind leg musculature. An ultrasound flow probe placed around the femoral artery provided flow measurements independent of MRI and served as the standard of reference. Images were acquired on a 1.5 T MRI scanner using a 3D T1-weighted gradient-echo sequence. An arterial catheter for local injection was implanted in the femoral artery. Continuous injection of adenosine for vasodilation resulted in steady blood flow levels up to four times the baseline level. In this way, three different stable perfusion levels were induced and measured. A central venous catheter was used for injection of two different types of contrast media. A low-molecular weight contrast medium and a blood pool contrast medium were used. A total of 6 perfusion measurements were performed with a time interval of about 20-25 min without significant differences in the arterial input functions. In conclusion the accuracy of DCE-MRI-based perfusion measurement can be validated by comparison of the integrated perfusion signal of the hind leg musculature with the blood flow values measured with the ultrasound flow probe around the femoral artery.
Figures


References
-
- Lüdemann L, Grieger W, Wurm R, Wust P, Zimmer C. Glioma assessment using quantitative blood volume maps generated by T1-weighted dynamic contrast-enhanced magnetic resonance imaging: a receiver operating characteristic study. Acta Radiologica. 2006;47(3):303–310. - PubMed
-
- Harrison LB, Chadha M, Hill RJ, Hu K, Shasha D. Impact of tumor hypoxia and anemia on radiation therapy outcomes. Oncologist. 2002;7(6):492–508. - PubMed
-
- Christian TF, Rettmann DW, Aletras AH, et al. Absolute myocardial perfusion in canines measured by using dual-bolus first-pass MR imaging. Radiology. 2004;232(3):677–684. - PubMed
-
- Sommer P. Erhöhte regionale Myokarddurchblutung und kontraktile Dysfunktion nach orthotoper Herztransplantation- Messungen mit fluoreszierenden Mikrosphären im Versuch am Hausschwein. Dissertation Freiburg i. Br; 2000.
-
- Weishaupt D, Koechli VD, Marincek B. Wie Funktioniert MRI?, 6.Aufl. Berlin, Germany: Springer Medizin; 2009.
MeSH terms
Substances
LinkOut - more resources
Full Text Sources
Other Literature Sources
Medical

