

Diagnosis of bladder cancer and prediction of survival by urinary metabolomics
- PMID: 24721970
- PMCID: PMC4039236
- DOI: 10.18632/oncotarget.1744
Diagnosis of bladder cancer and prediction of survival by urinary metabolomics
Abstract
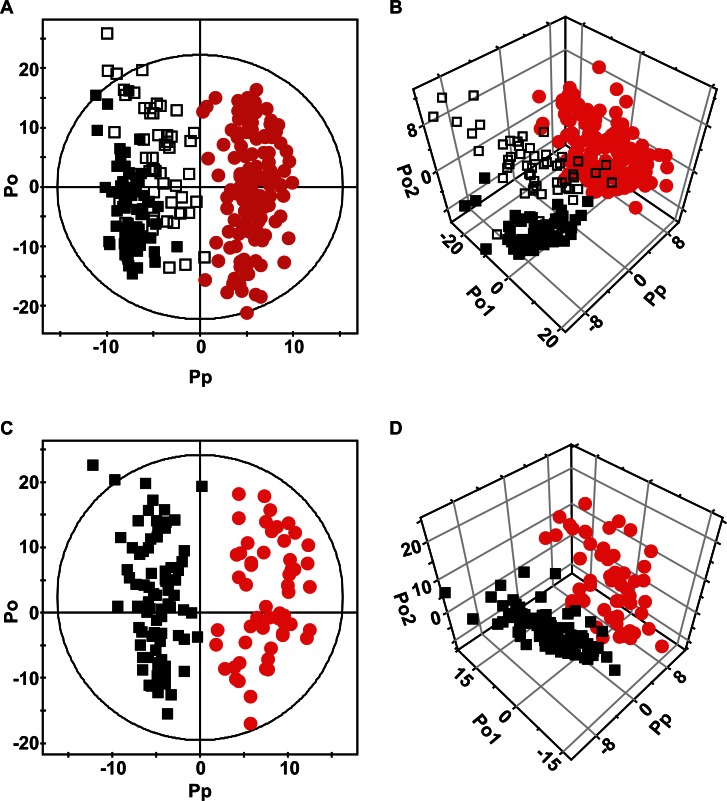
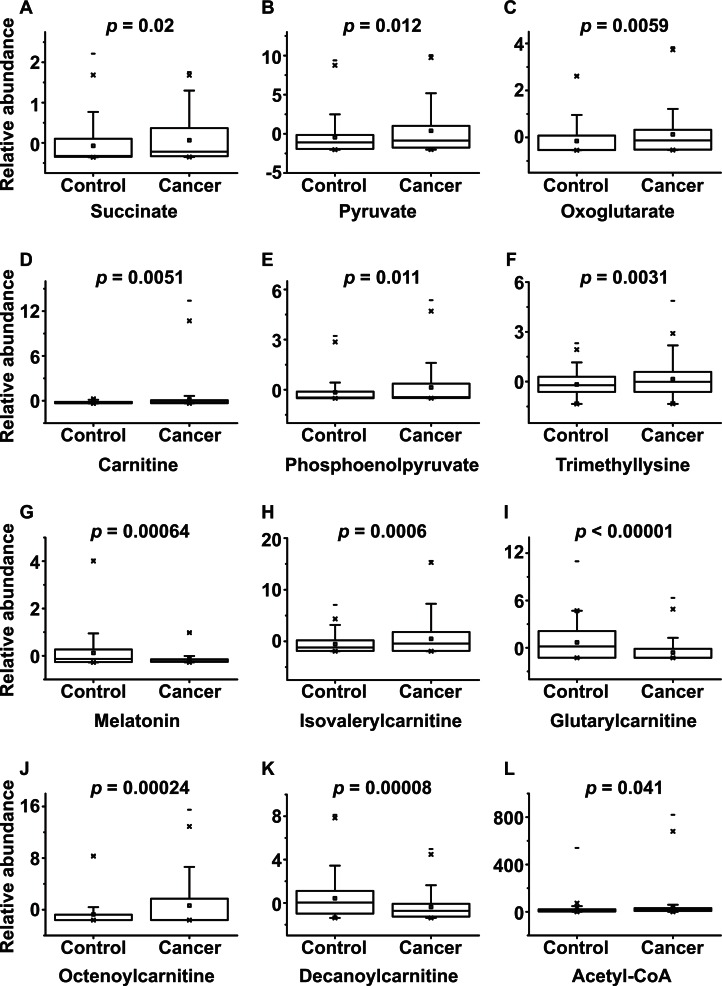
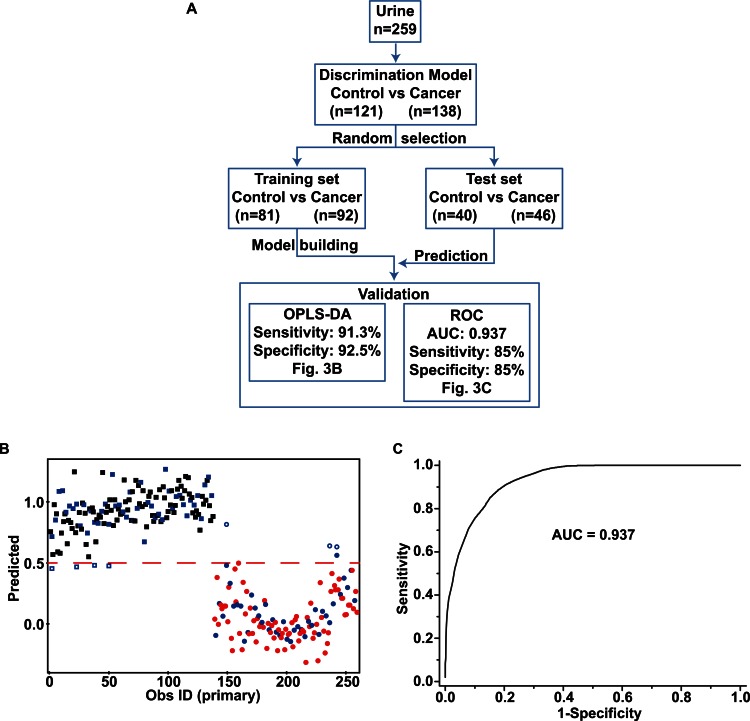
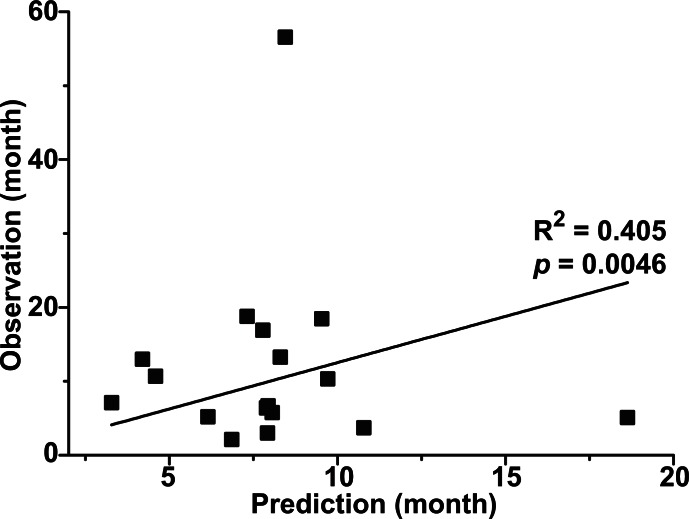
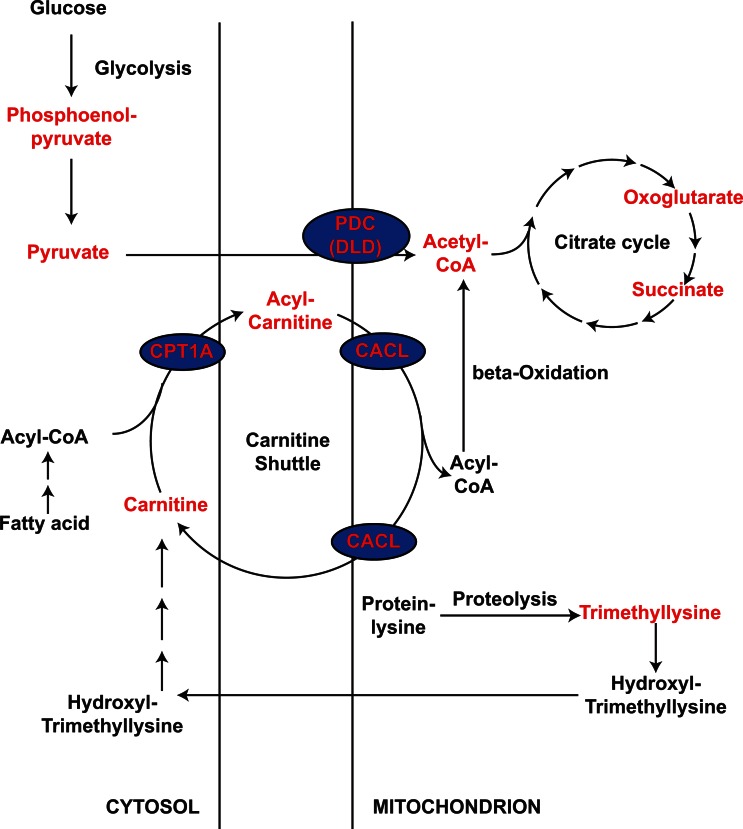
Bladder cancer (BC) is a common cancer but diagnostic modalities, such as cystoscopy and urinary cytology, have limitations. Here, high-performance liquid chromatography-quadrupole time-of-flight mass spectrometry (HPLC-QTOFMS) was used to profile urine metabolites of 138 patients with BC and 121 control subjects (69 healthy people and 52 patients with hematuria due to non-malignant diseases). Multivariate statistical analysis revealed that the cancer group could be clearly distinguished from the control groups on the basis of their metabolomic profiles, even when the hematuric control group was included. Patients with muscle-invasive BC could also be distinguished from patients with non-muscle-invasive BC on the basis of their metabolomic profiles. Successive analyses identified 12 differential metabolites that contributed to the distinction between the BC and control groups, and many of them turned out to be involved in glycolysis and betaoxidation. The association of these metabolites with cancer was corroborated by microarray results showing that carnitine transferase and pyruvate dehydrogenase complex expressions are significantly altered in cancer groups. In terms of clinical applicability, the differentiation model diagnosed BC with a sensitivity and specificity of 91.3% and 92.5%, respectively, and comparable results were obtained by receiver operating characteristic analysis (AUC = 0.937). Multivariate regression also suggested that the metabolomic profile correlates with cancer-specific survival time. The excellent performance and simplicity of this metabolomics-based approach suggests that it has the potential to augment or even replace the current modalities for BC diagnosis.
Figures
References
-
- Burger M, Catto JW, Dalbagni G, Grossman HB, Herr H, Karakiewicz P, Kassouf W, Kiemeney LA, La Vecchia C, Shariat S, Lotan Y. Epidemiology and risk factors of urothelial bladder cancer. Eur Urol. 2013;63(2):234–241. - PubMed
-
- Sylvester RJ, van der Meijden AP, Oosterlinck W, Witjes JA, Bouffioux C, Denis L, Newling DW, Kurth K. Predicting recurrence and progression in individual patients with stage Ta T1 bladder cancer using EORTC risk tables: a combined analysis of 2596 patients from seven EORTC trials. Eur Urol. 2006;49(3):466–465. discussion 475-467. - PubMed
-
- Stenzl A, Cowan NC, de Santis M, Kuczyk MA, Merseburger AS, Ribal MJ, Sherif A, Witjes JA. Treatment of muscle-invasive and metastatic bladder cancer: update of the EAU guidelines. Eur Urol. 2011;59(6):1009–1018. - PubMed
-
- OuYang D, Xu J, Huang H, Chen Z. Metabolomic profiling of serum from human pancreatic cancer patients using 1H NMR spectroscopy and principal component analysis. Applied biochemistry and biotechnology. 2011;165(1):148–154. - PubMed
Publication types
MeSH terms
Substances
LinkOut - more resources
Full Text Sources
Other Literature Sources
Medical
