Time course of physiological and psychological responses in humans during a 20-day severe-cold-acclimation programme
- PMID: 24722189
- PMCID: PMC3983237
- DOI: 10.1371/journal.pone.0094698
Time course of physiological and psychological responses in humans during a 20-day severe-cold-acclimation programme
Abstract
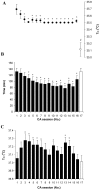
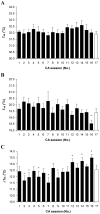
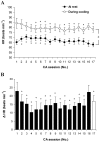
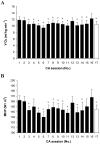
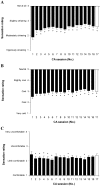
The time course of physiological and psychological markers during cold acclimation (CA) was explored. The experiment included 17 controlled (i.e., until the rectal temperature reached 35.5°C or 170 min had elapsed; for the CA-17 session, the subjects (n = 14) were immersed in water for the same amount of time as that used in the CA-1 session) head-out water immersions at a temperature of 14°C over 20 days. The data obtained in this study suggest that the subjects exhibited a thermoregulatory shift from peripheral-to-central to solely central input thermoregulation, as well as from shivering to non-shivering thermogenesis throughout the CA. In the first six CA sessions, a hypothermic type of acclimation was found; further CA (CA-7 to CA-16) led to a transitional shift to a hypothermic-insulative type of acclimation. Interestingly, when the subjects were immersed in water for the same time as that used in the CA-1 session (CA-17), the CA led to a hypothermic type of acclimation. The presence of a metabolic type of thermogenesis was evident only under thermoneutral conditions. Cold-water immersion decreased the concentration of cold-stress markers, reduced the activity of the innate immune system, suppressed specific immunity to a lesser degree and yielded less discomfort and cold sensation. We found a negative correlation between body mass index and Δ metabolic heat production before and after CA.
Conflict of interest statement
Figures





Similar articles
-
Thermoregulation in winter swimmers and physiological significance of human catecholamine thermogenesis.Exp Physiol. 2000 May;85(3):321-6. Exp Physiol. 2000. PMID: 10825419 Clinical Trial.
-
Cold Acclimation Does Not Alter Physiological or Perceptual Responses During Subsequent Exercise in the Heat.Mil Med. 2017 Sep;182(9):e1958-e1964. doi: 10.7205/MILMED-D-16-00284. Mil Med. 2017. PMID: 28885962
-
Changes in thermal homeostasis in humans due to repeated cold water immersions.Pflugers Arch. 1996 Jul;432(3):368-72. doi: 10.1007/s004240050146. Pflugers Arch. 1996. PMID: 8765994 Clinical Trial.
-
Human physiological responses to cold exposure: Acute responses and acclimatization to prolonged exposure.Auton Neurosci. 2016 Apr;196:63-74. doi: 10.1016/j.autneu.2016.02.009. Epub 2016 Feb 21. Auton Neurosci. 2016. PMID: 26924539 Review.
-
Factors affecting cold acclimation and thermogenesis in man.Med Sci Sports Exerc. 1988 Oct;20(5 Suppl):S193-6. doi: 10.1249/00005768-198810001-00018. Med Sci Sports Exerc. 1988. PMID: 3057321 Review.
Cited by
-
A century of exercise physiology: concepts that ignited the study of human thermoregulation. Part 3: Heat and cold tolerance during exercise.Eur J Appl Physiol. 2024 Jan;124(1):1-145. doi: 10.1007/s00421-023-05276-3. Epub 2023 Oct 5. Eur J Appl Physiol. 2024. PMID: 37796292 Review.
-
The influence of environmental and core temperature on cyclooxygenase and PGE2 in healthy humans.Sci Rep. 2021 Mar 22;11(1):6531. doi: 10.1038/s41598-021-84563-5. Sci Rep. 2021. PMID: 33753764 Free PMC article.
-
Human whole body cold adaptation.Temperature (Austin). 2016 Feb 22;3(1):104-18. doi: 10.1080/23328940.2015.1135688. eCollection 2016 Jan-Mar. Temperature (Austin). 2016. PMID: 27227100 Free PMC article. Review.
-
The positive effects of combined breathing techniques and cold exposure on perceived stress: a randomised trial.Curr Psychol. 2022 Oct 7:1-13. doi: 10.1007/s12144-022-03739-y. Online ahead of print. Curr Psychol. 2022. PMID: 36248220 Free PMC article.
-
A century of exercise physiology: concepts that ignited the study of human thermoregulation. Part 4: evolution, thermal adaptation and unsupported theories of thermoregulation.Eur J Appl Physiol. 2024 Jan;124(1):147-218. doi: 10.1007/s00421-023-05262-9. Epub 2023 Oct 5. Eur J Appl Physiol. 2024. PMID: 37796290 Review.
References
-
- Allen TH, Peng MT, Chen KP, Huang TF, Chang C, et al. (1956) Prediction of total adiposity from skinfolds and the curvilinear relationship between external and internal adiposity. Metabolism 5(3): 346–52. - PubMed
-
- Astrup A, Bülow J, Madsen J, Christensen NJ (1985) Contribution of BAT and skeletal muscle to thermogenesis induced by ephedrine in man. Am J Physiol 248(5 Pt 1): E507–15. - PubMed
-
- Astrup A, Lundsgaard C, Madsen J, Christensen NJ (1985) Enhanced thermogenic responsiveness during chronic ephedrine treatment in man. Am J Clin Nutrb 42(1): 83–94. - PubMed
-
- Bittel J (1992) The different types of general cold adaptation in man. Int J Sports Med 13 Suppl 1: S172–6. - PubMed
-
- Bittel JH (1987) Heat debt as an index for cold adaptation in men. J Appl Physiol 62(4): 1627–34. - PubMed
MeSH terms
LinkOut - more resources
Full Text Sources
Other Literature Sources
Medical
Miscellaneous

