

Parp inhibition prevents ten-eleven translocase enzyme activation and hyperglycemia-induced DNA demethylation
- PMID: 24722243
- PMCID: PMC4141369
- DOI: 10.2337/db13-1916
Parp inhibition prevents ten-eleven translocase enzyme activation and hyperglycemia-induced DNA demethylation
Abstract
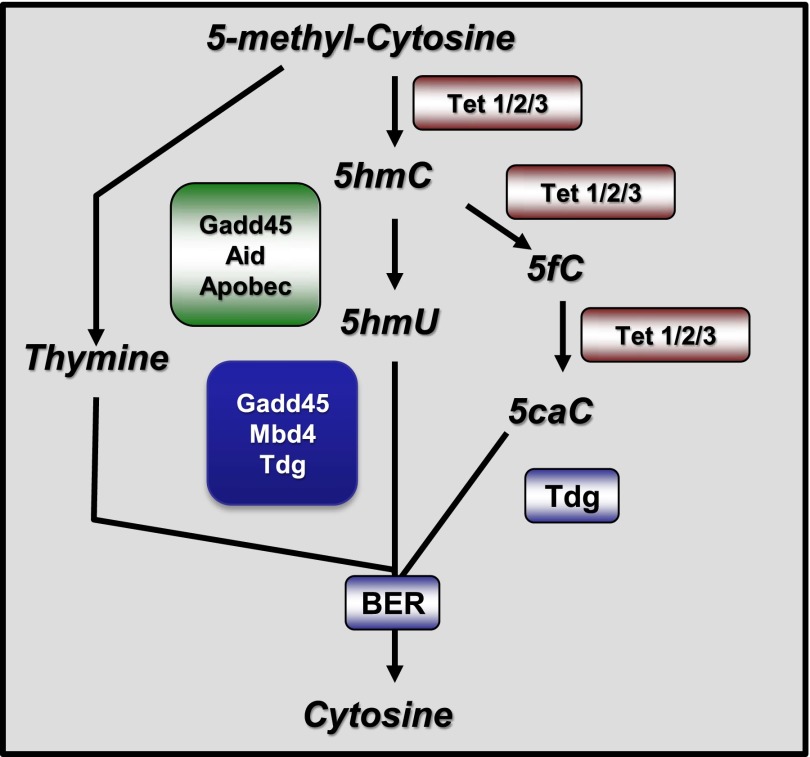
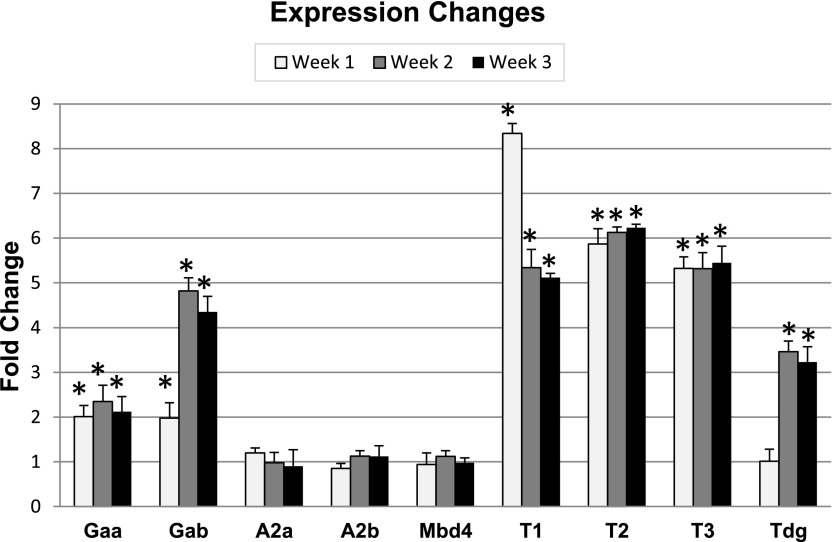
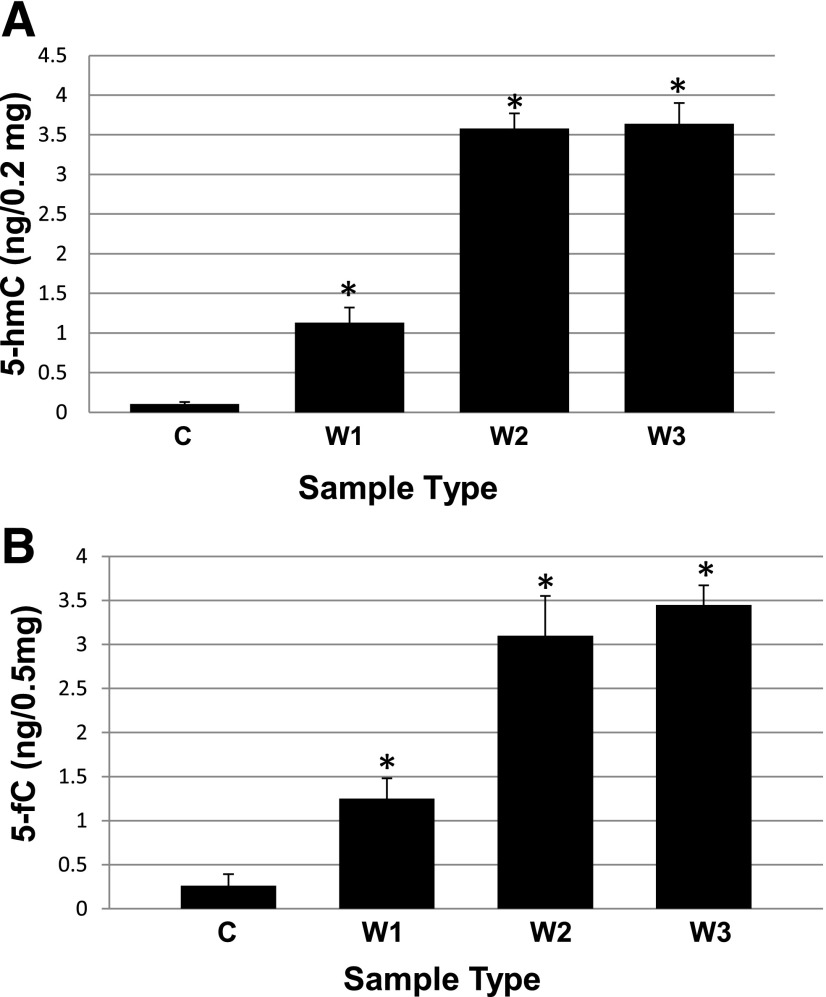
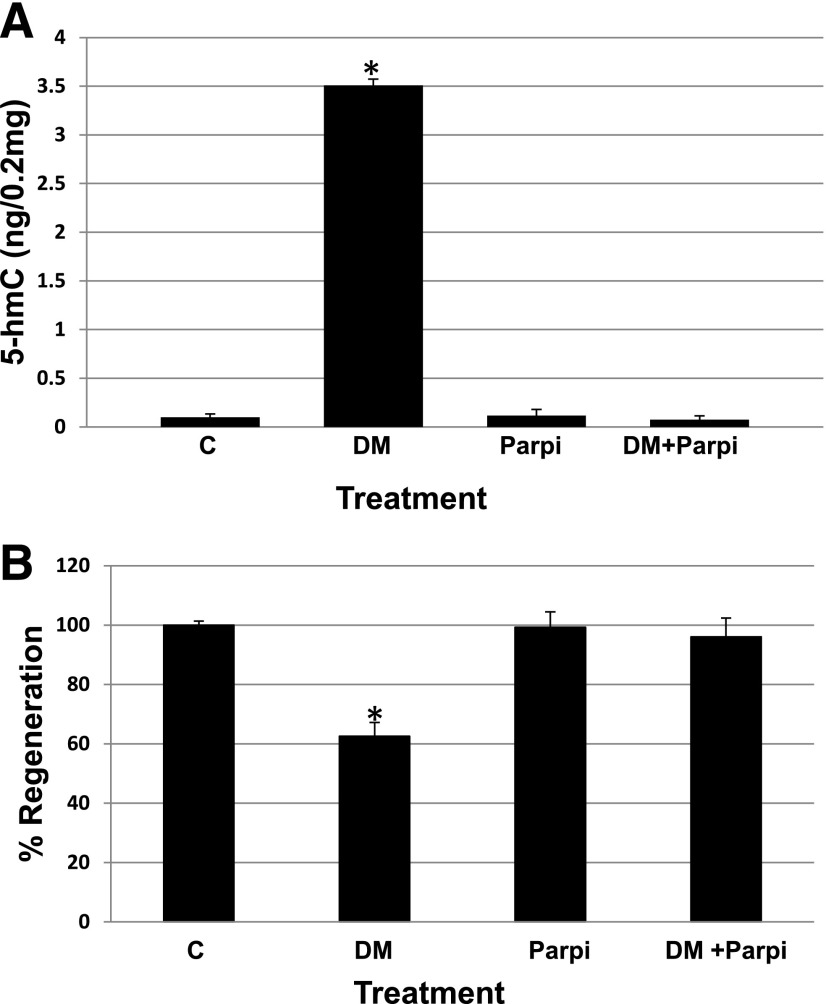
Studies from human cells, rats, and zebrafish have documented that hyperglycemia (HG) induces the demethylation of specific cytosines throughout the genome. We previously documented that a subset of these changes become permanent and may provide, in part, a mechanism for the persistence of complications referred to as the metabolic memory phenomenon. In this report, we present studies aimed at elucidating the molecular machinery that is responsible for the HG-induced DNA demethylation observed. To this end, RNA expression and enzymatic activity assays indicate that the ten-eleven translocation (Tet) family of enzymes are activated by HG. Furthermore, through the detection of intermediates generated via conversion of 5-methyl-cytosine back to the unmethylated form, the data were consistent with the use of the Tet-dependent iterative oxidation pathway. In addition, evidence is provided that the activity of the poly(ADP-ribose) polymerase (Parp) enzyme is required for activation of Tet activity because the use of a Parp inhibitor prevented demethylation of specific loci and the accumulation of Tet-induced intermediates. Remarkably, this inhibition was accompanied by a complete restoration of the tissue regeneration deficit that is also induced by HG. The ultimate goal of this work is to provide potential new avenues for therapeutic discovery.
© 2014 by the American Diabetes Association. Readers may use this article as long as the work is properly cited, the use is educational and not for profit, and the work is not altered.
Figures
Comment in
-
Role for tet in hyperglycemia-induced demethylation: a novel mechanism of diabetic metabolic memory.Diabetes. 2014 Sep;63(9):2906-8. doi: 10.2337/db14-0675. Diabetes. 2014. PMID: 25146472 No abstract available.
References
-
- Shaw JE, Sicree RA, Zimmet PZ. Global estimates of the prevalence of diabetes for 2010 and 2030. Diabetes Res Clin Pract 2010;87:4–14 - PubMed
-
- Engerman RL, Kern TS. Progression of incipient diabetic retinopathy during good glycemic control. Diabetes 1987;36:808–812 - PubMed
-
- Hammes HP, Klinzing I, Wiegand S, Bretzel RG, Cohen AM, Federlin K. Islet transplantation inhibits diabetic retinopathy in the sucrose-fed diabetic Cohen rat. Invest Ophthalmol Vis Sci 1993;34:2092–2096 - PubMed
-
- Kowluru RA. Effect of reinstitution of good glycemic control on retinal oxidative stress and nitrative stress in diabetic rats. Diabetes 2003;52:818–823 - PubMed
-
- Kowluru RA, Chakrabarti S, Chen S. Re-institution of good metabolic control in diabetic rats and activation of caspase-3 and nuclear transcriptional factor (NF-kappaB) in the retina. Acta Diabetol 2004;41:194–199 - PubMed
Publication types
MeSH terms
Substances
Grants and funding
LinkOut - more resources
Full Text Sources
Other Literature Sources
Medical
Molecular Biology Databases
