. 2014 Apr 15;5(7):1942-54.
doi: 10.18632/oncotarget.1879.

Discovery and validation of an INflammatory PROtein-driven GAstric cancer Signature (INPROGAS) using antibody microarray-based oncoproteomics

Affiliations

Discovery and validation of an INflammatory PROtein-driven GAstric cancer Signature (INPROGAS) using antibody microarray-based oncoproteomics

Manuel Puig-Costa et al. Oncotarget. .

Abstract

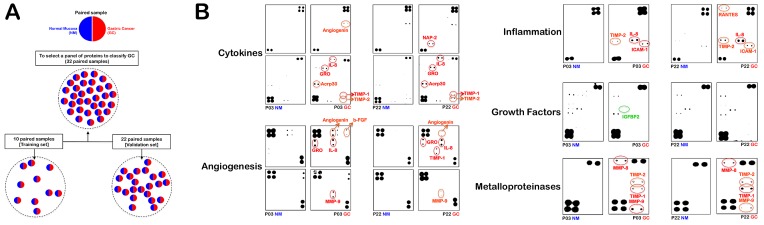
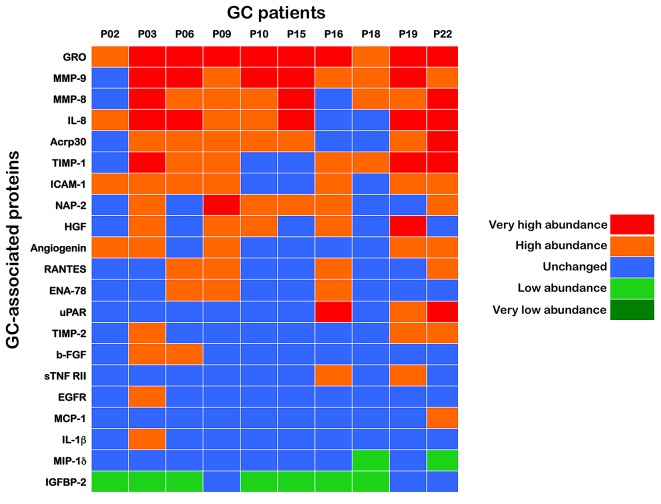
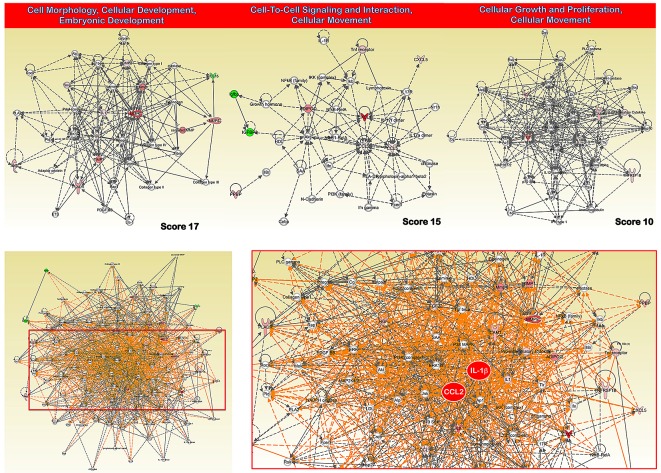
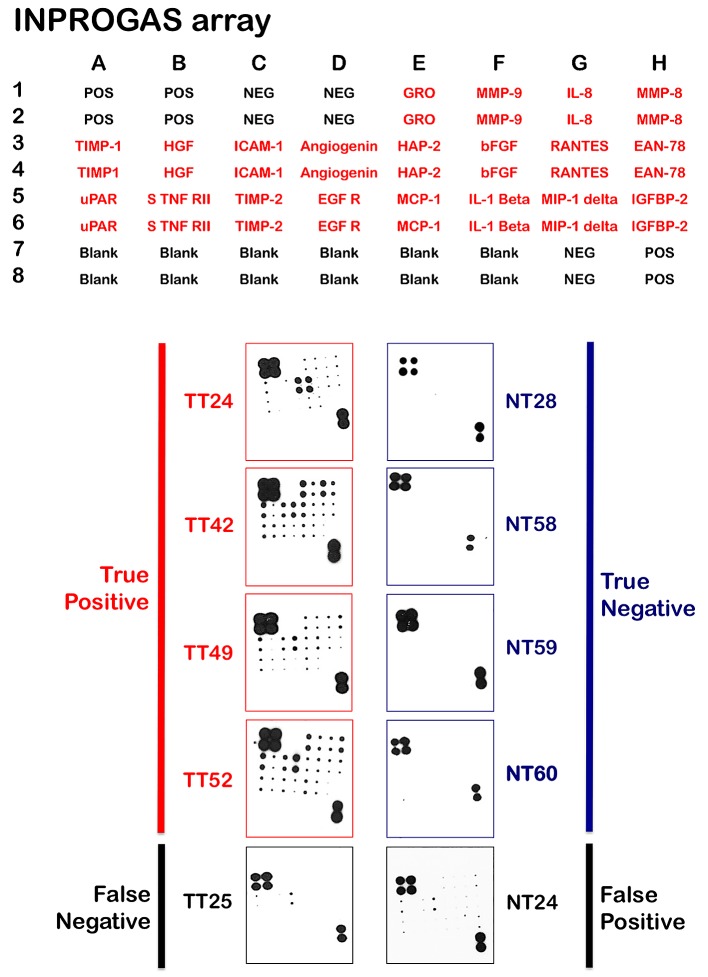
This study aimed to improve gastric cancer (GC) diagnosis by identifying and validating an INflammatory PROtein-driven GAstric cancer Signature (hereafter INPROGAS) using low-cost affinity proteomics. The detection of 120 cytokines, 43 angiogenic factors, 41 growth factors, 40 inflammatory factors and 10 metalloproteinases was performed using commercially available human antibody microarray-based arrays. We identified 21 inflammation-related proteins (INPROGAS) with significant differences in expression between GC tissues and normal gastric mucosa in a discovery cohort of matched pairs (n=10) of tumor/normal gastric tissues. Ingenuity pathway analysis confirmed the "inflammatory response", "cellular movement" and "immune cell trafficking" as the most overrepresented biofunctions within INPROGAS. Using an expanded independent validation cohort (n = 22), INPROGAS classified gastric samples as "GC" or "non-GC" with a sensitivity of 82% (95% CI 59-94) and a specificity of 73% (95% CI 49-89). The positive predictive value and negative predictive value in this validation cohort were 75% (95% CI 53-90) and 80% (95% CI 56-94), respectively. The positive predictive value and negative predictive value in this validation cohort were 75% (95% CI 53-90) and 80% (95% CI 56-94), respectively. Antibody microarray analyses of the GC-associated inflammatory proteome identified a 21-protein INPROGAS that accurately discriminated GC from noncancerous gastric mucosa.


Figures

Figure 1
Figure 1. INPROGAS: Study outline and representative antibody-based array chips
A. Informed consent was obtained from all human subjects according to the ethics committee guidelines at the Hospital Dr. Josep Trueta, Girona (Spain). A total of 32 paired GC/non-GC samples were separated into a training set (n=10) and a validation set (n=22), as indicated. B. This figure shows antibody-based array chips encompassing 120 cytokines, 43 angiogenic factors, 41 growth factors, 40 inflammatory factors and 10 metalloproteinases in duplicates probed with whole lysates from paired GC and non-GC mucosae in patients #3 and #22 (NM: Normal mucosa; GC: Gastric carcinoma). The membranes were treated with antibody cocktails, developed by an ECL kit and exposed to an X-ray film as described in the “Materials and Methods”. The intensity of each signal was evaluated photometrically using integrator software and normalized to the background noise in each spot relative to the negative controls. The spot intensities of each protein in replicates were then merged and expressed as a mean value relative to the average signals of the positive controls (membrane-bound biotin-conjugated antibodies) on the array chip analyzed for each experimental (GC) and control (NM) paired group.
Figure 2
Figure 2. INPROGAS: A 21-protein signature that discriminates GC from noncancerous gastric mucosa
Upon calculation of fold-changes for expression in GC relative to the matched non-GC sample, all proteins that were significantly expressed in a given GC tissue were arbitrarily placed into several “expression groups” based on their intensities relative to the paired non-GC tissue. We analyzed normalized array measurements in the training set to discover differences in protein abundance between samples of GC and those of non-GC to generate a signature of the inflammatory proteome (INPROGAS). Patient data were arranged in columns, and the proteins are listed in rows. Red shades, very high abundance (10-fold and over); orange shades, high abundance (3-fold to < 10-fold); blue shades, no-change (< ±3-fold); light green, low abundance (-3-fold to < -10-fold); dark green, very low abundance (-10-fold and under).
Figure 3
Figure 3. INPROGAS: a functional analysis
Network analysis of differentially expressed proteins included in INPROGAS. A dataset containing the differentially expressed biomarkers in GC tissues (called the focus molecules, n=21) was overlaid onto a global molecular network developed from information contained in the IPA Knowledge Base. Networks of these focus molecules were then algorithmically generated based on their connectivity. Top. The figure shows the networks with the 3 highest IPA scores (a composite measure indicating the statistical significance of the interconnection between the molecules depicted in the network). The focus molecules are colored according to the gene expression (fold change) value; red gene symbols indicate upregulation, and green gene symbols indicate downregulation. The nodes are displayed using various shapes that represent the functional class of the gene product. Edges with dashed lines indicate indirect interactions, while continuous lines represent direct interactions. Bottom. Merged network combining major signaling networks depicted in top panels associated with the proteins included in INPROGAS.
Figure 4
Figure 4. Classification and prediction of GC diagnosis using INPROGAS
A. This figure shows antibody-based array INPROGAS chips for assessing the performance of the in the classification of unknown samples. B. The INPROGAS predictors identified in the training set were used for GC and non-GC class prediction in a blinded test set including 22 paired samples. This figure shows representative antibody-based array chips encompassing the 20 INPROGAS predictors (Acrp30 was excluded from the INPROGAS chip due to technical issues) in duplicates probed with whole lysates from non-tumor tissue (NT) and tumoral tissue (TT). The figure shows several representative images of tissues catalogued as true positive, true negative, false negative, and false positive.

References

    1. Jemal A, Siegel R, Ward E, Hao Y, Xu J, Murray T, Thun MJ. Cancer statistics, 2008. CA Cancer J Clin. 2008;58:71–96. - PubMed
    1. Mori M, Mimori K, Shiraishi T, Tanaka S, Ueo H, Sugimachi K, Akiyoshi T. p27 expression and gastric carcinoma. Nat Med. 1997;3:593. - PubMed
    1. Akama Y, Yasui W, Yokozaki H, Kuniyasu H, Kitahara K, Ishikawa T, Tahara E. Frequent amplification of the cyclin E gene in human gastric cancer. Jpn J Cancer Res. 1995;86:617–621. - PMC - PubMed
    1. Graziano F, Mandolesi A, Ruzzo A, Bearzi I, Testa E, Arduini F, Silva R, Muretto P, Mari D, Berardi R, Scartozzi M, Lai V, Cascinu S, Magnani M. Predictive and prognostic role of E-cadherin protein expression in patients with advanced gastric carcinomas treated with palliative chemotherapy. Tumour Biol. 2004;25:106–110. - PubMed
    1. Sanz-Ortega J, Steinburg SM, Moro E, Saez M, Lopez JA, Sierra E, Sanz-Esponera J, Merino MJ. Comparative study of tumor angio- genesis and immunohistochemistry for p53, c-erbB2, c-myc and EGFr as prognostic factors in gastric cancer. Histol Histopathol. 2000;15:455–462. - PubMed

Publication types