Clinical Trial
. 2014 Apr 10;10(4):e1004071.
doi: 10.1371/journal.ppat.1004071. eCollection 2014 Apr.

Histone deacetylase inhibitor romidepsin induces HIV expression in CD4 T cells from patients on suppressive antiretroviral therapy at concentrations achieved by clinical dosing

Affiliations
Clinical Trial

Histone deacetylase inhibitor romidepsin induces HIV expression in CD4 T cells from patients on suppressive antiretroviral therapy at concentrations achieved by clinical dosing

Datsen George Wei et al. PLoS Pathog. .

Abstract

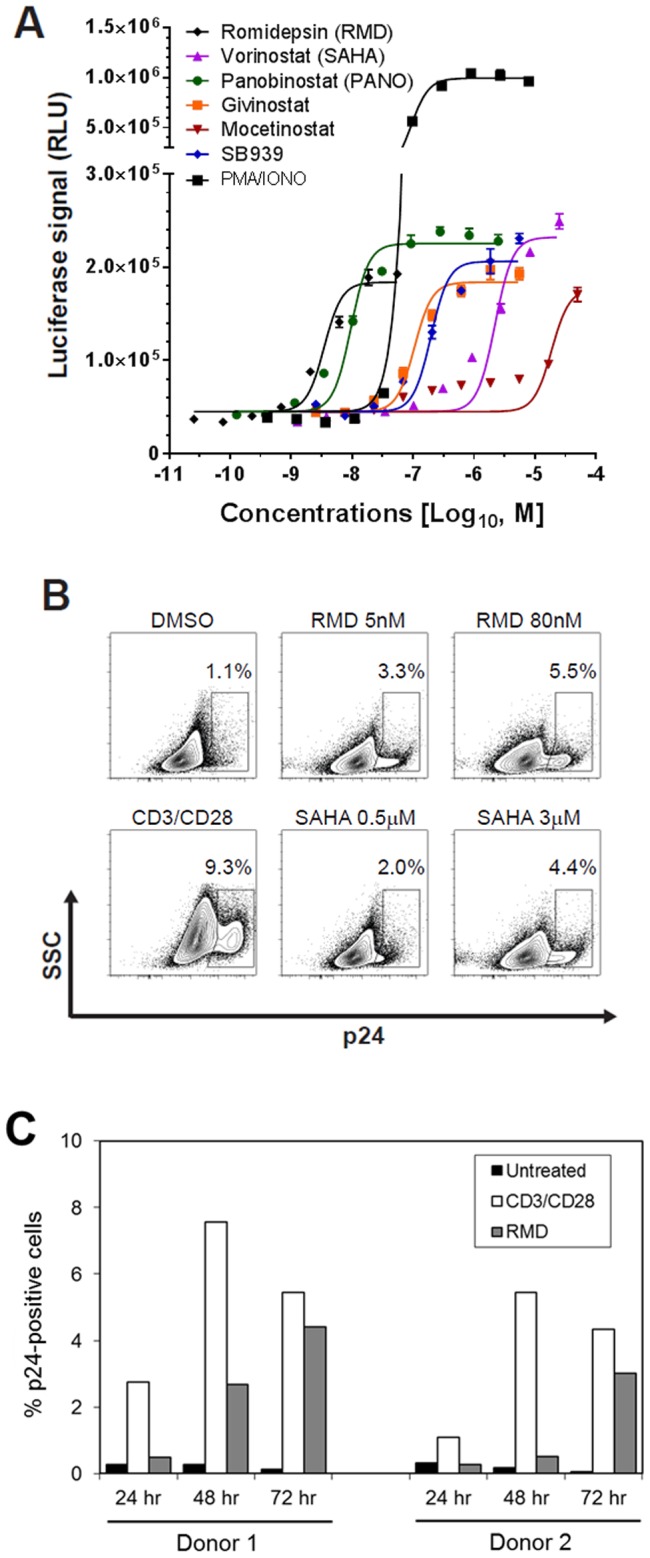
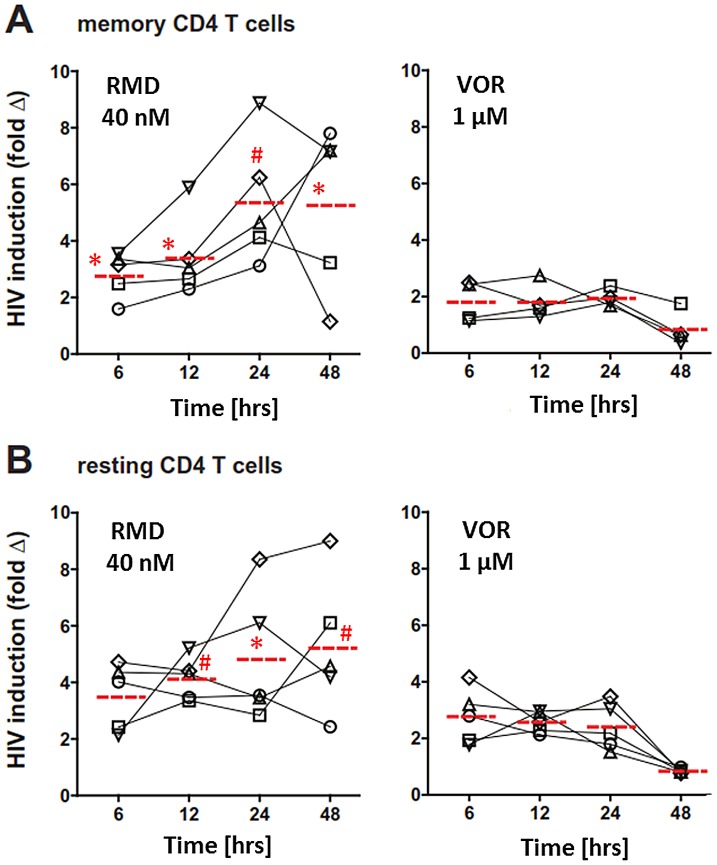
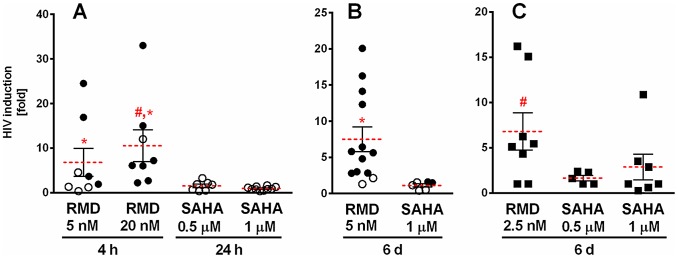
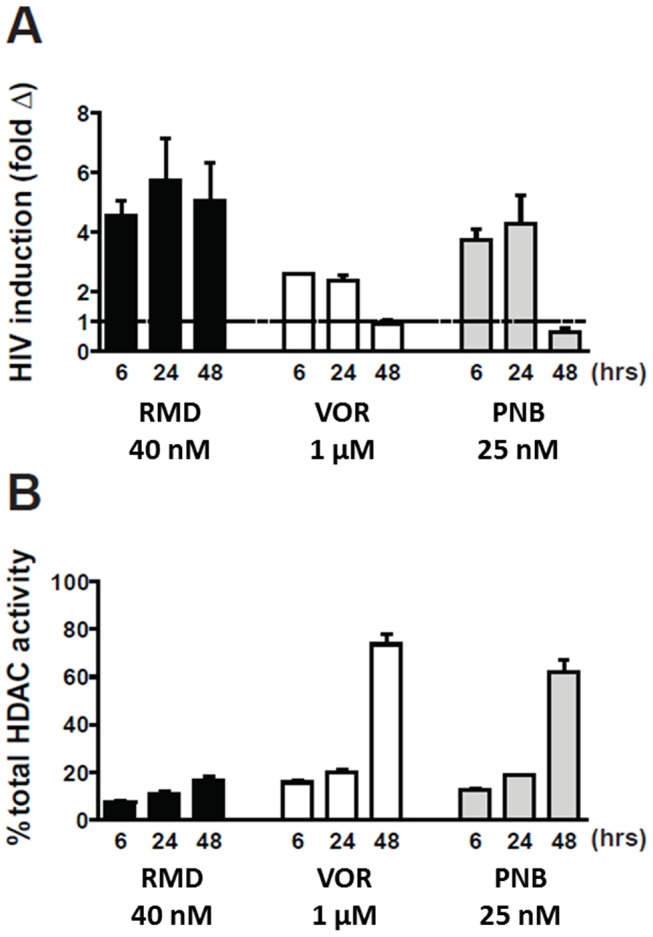
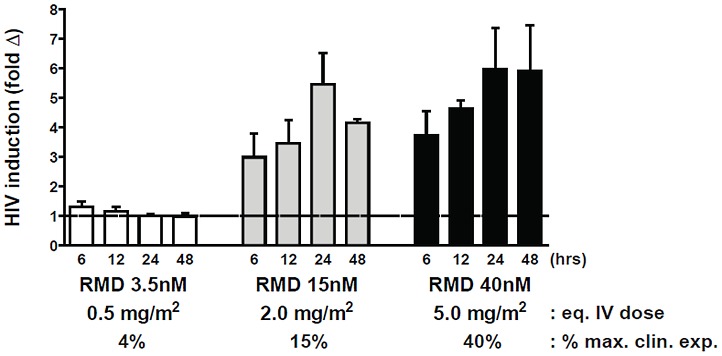
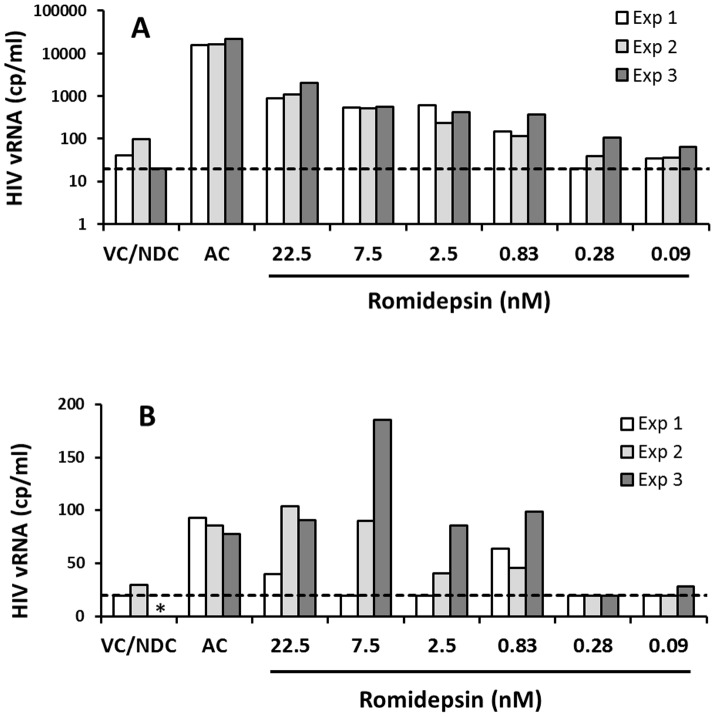
Persistent latent reservoir of replication-competent proviruses in memory CD4 T cells is a major obstacle to curing HIV infection. Pharmacological activation of HIV expression in latently infected cells is being explored as one of the strategies to deplete the latent HIV reservoir. In this study, we characterized the ability of romidepsin (RMD), a histone deacetylase inhibitor approved for the treatment of T-cell lymphomas, to activate the expression of latent HIV. In an in vitro T-cell model of HIV latency, RMD was the most potent inducer of HIV (EC50 = 4.5 nM) compared with vorinostat (VOR; EC50 = 3,950 nM) and other histone deacetylase (HDAC) inhibitors in clinical development including panobinostat (PNB; EC50 = 10 nM). The HIV induction potencies of RMD, VOR, and PNB paralleled their inhibitory activities against multiple human HDAC isoenzymes. In both resting and memory CD4 T cells isolated from HIV-infected patients on suppressive combination antiretroviral therapy (cART), a 4-hour exposure to 40 nM RMD induced a mean 6-fold increase in intracellular HIV RNA levels, whereas a 24-hour treatment with 1 µM VOR resulted in 2- to 3-fold increases. RMD-induced intracellular HIV RNA expression persisted for 48 hours and correlated with sustained inhibition of cell-associated HDAC activity. By comparison, the induction of HIV RNA by VOR and PNB was transient and diminished after 24 hours. RMD also increased levels of extracellular HIV RNA and virions from both memory and resting CD4 T-cell cultures. The activation of HIV expression was observed at RMD concentrations below the drug plasma levels achieved by doses used in patients treated for T-cell lymphomas. In conclusion, RMD induces HIV expression ex vivo at concentrations that can be achieved clinically, indicating that the drug may reactivate latent HIV in patients on suppressive cART.


Conflict of interest statement

DGW, VC, MB, TB, MG, JH, AI, JPM, GS, KMS, AT, HY, DS, RG, and TC are employees of Gilead Sciences, Inc. JM is a scientific advisor of Gilead Sciences, Inc. JL is a director of Quest Clinical Research that provided clinical specimens. EF, JS, MK, CAS, and DM have no competing interests. Part of the study was funded by Gilead Sciences, Inc. Employees of the company were involved in study design, data collection and analysis, and writing the manuscript. However, none of the therapeutics characterized in this study are products of Gilead Sciences, and studies were designed, executed, and objectively interpreted purely with a purpose to advance basic research in the field of HIV latency and cure. This does not alter our adherence to all PLOS Pathogens policies on sharing data and materials.

Figures

Figure 1
Figure 1. In vitro activation of HIV expression by HDAC inhibitors in an in vitro latency model.
Primary CD4 T cells latently infected in vitro with reporter HIV were established as previously described , with additional minor modifications described in Materials and Methods. The infected cells were incubated in the presence of the indicated HDACi. (A) A dose response of HIV activation by HDACi was determined by the quantification of luciferase reporter activity after a 48-hour treatment. Results are mean ± SD from a representative experiment performed in quadruplicate. (B) Induction of p24 expression by RMD and VOR. Flow cytometry analysis of cells from a representative donor is shown with gating on the live cell population. Anti-CD3/CD28 antibodies conjugated to beads were used as a positive control. (C) Time course of the induction of p24 expression by RMD. Cells isolated from 2 independent donors were treated with 40 nM RMD or anti-CD3/CD28 antibodies for 24 to 72 hours in the presence of antiretrovirals. Percentage of p24-positive cells was determined by flow cytometry with gating on live cell population.
Figure 2
Figure 2. Ex vivo activation of HIV expression by RMD and VOR.
CD4 T cells were isolated from virally suppressed HIV-infected patients and pulse-treated with RMD and VOR for 6 and 24 hours, respectively. Cell-associated total RNA was extracted, HIV RNA levels were quantified at the indicated time points, and fold increase in the cell-associated HIV RNA was determined relative to corresponding vehicle-treated control for each individual time point. The fold change for each donor and condition is based on mean number of HIV copies from 4 to 5 independent measurements. Red dashed line represents the mean fold HIV induction across all tested donors. Symbols # (p<0.01) and * (p<0.05) denote a statistically significant difference between fold HIV induction by RMD and VOR across all donors tested. Data for each individual donor and condition including results of statistical analysis are provided in Supplementary Table S4. (A) Memory CD4 T cells were purified as the CD4(+)CD45RA(−) subset. (B) Resting CD4+ T cells were purified as the CD4(+)HLA-DR(−)CD69(−)CD25(−) subset.
Figure 3
Figure 3. Induction of extracellular viral RNA release from CD4 T cells treated with RMD and VOR.
Memory or resting CD4 T cells isolated from HIV-infected patients on suppressive cART were treated with RMD or VOR, and viral RNA was quantified in cell culture supernatants 6 days after the addition of drugs. Results are depicted as fold increase in viral RNA relative to control cultures. Each symbol represents one HIV subject. Solid circles, p<0.05; open circles, p>0.05 compared to vehicle-treated controls from the same donors; solid squares, p value not calculated. Red lines represent the mean fold HIV induction across all analyzed donors. Symbols # and * denote a statistically significant difference (p<0.05) for RMD-mediated HIV induction vs. 0.5 and 1 µM VOR, respectively, across all tested donors. Data for each individual donor and condition including results of the statistical analysis are summarized in Supplementary Table S4. (A) Memory CD4 T cells were treated with RMD and VOR for 4 and 24 hours, respectively. (B) Memory CD4 T cells were treated continuously for 6 days. (C) Resting CD4 T cells were treated continuously for 6 days.
Figure 4
Figure 4. Induction of HIV expression and inhibition of cell-associated HDAC activity by HDACi.
Resting CD4 T cells isolated from cART-suppressed HIV-infected patients were pulse-treated with RMD (4 hours), VOR (24 hours), and PNB (24 hours). Viral RNA was determined 48 hours after the initiation of the treatment. Data represent mean ± SD from two independent donors. (A) Cell-associated total RNA was extracted at the indicated time points, and HIV RNA levels were quantified. Data for each individual donor and condition including results of the statistical analysis are summarized in Supplementary Table S4. (B) Total class I and II HDAC enzyme activity was measured in total cell extracts of treated cells relative to vehicle-treated cells (representing 100% activity) using a model substrate described in Materials and Methods.
Figure 5
Figure 5. RMD activates intracellular HIV expression at concentrations below the levels achieved by clinical dosing.
Resting CD4 T cells were isolated from 3 cART-suppressed HIV-infected patients and pulse-treated with RMD for 4 hours with the indicated concentrations. Cell-associated HIV RNA levels were analyzed at each time point following the treatment initiation (t = 0 hour), and fold induction was determined relative to a background signal in vehicle-treated controls. Predicted i.v. dose and percentage of clinical exposure were calculated for each RMD concentration tested relative to the clinically approved dose of 14 mg/m2; calculations were performed based on the free fraction of drug in human plasma and cell culture media. Data represent mean ± SD from at least 3 HIV-infected donors. Data for each individual donor and condition including results of the statistical analysis are summarized in Supplementary Table S4.
Figure 6
Figure 6. RMD does not induce global activation of immune cell subsets.
PBMCs isolated from four HIV-infected patients on suppressive cART were treated with a 4-hour pulse of RMD or continuously with vehicle control (DMSO), VOR, or PMA+ionomycin and stained for surface markers 48 hours after the treatment initiation. Fractions of CD69−, CD25−, and HLA-DR-positive cells in subsets of CD4+ T cells, CD8+ T cells, and CD19+ B cells were analyzed by flow cytometry as described in Materials and Methods. Each symbol represents one donor.
Figure 7
Figure 7. Ex vivo response to RMD in multiple longitudinal samples from the same donors.
Resting CD4 T cells isolated from 2 cART-suppressed HIV-infected patients were treated continuously with RMD or with anti-CD3/CD28 antibodies (AC, activation control) for 7 days. HIV RNA in cell culture supernatants was quantified by COBAS on day 7. Data for a high-responding (A) and a low-responding donor (B) to RMD is shown; each donor was tested at 3 different time points separated by at least 2 weeks (Exp 1–3). VC/NDC, vehicle control/no-drug control. Asterisk (*) indicates no value due to COBAS analysis failure. Dashed lines indicate the limit of HIV quantification by COBAS (20 copies/ml). Data for each individual donor and condition including results of the statistical analysis are summarized in Supplementary Table S4.
Figure 8
Figure 8. Phylogenetic analysis of HIV sequences expressed ex vivo following the latency reversal.
Resting CD4 T cells isolated from a cART-suppressed HIV-infected patient (high-responding patient from Fig. 7) were treated continuously with RMD or activation control (anti-CD3/CD28 antibodies). Single-genome sequencing was used to analyze patient HIV proviral DNA and plasma RNA at the initiation of treatment (day 0), together with the ex vivo induced HIV RNA in cell culture supernatants at the end of treatment (day 7). Total of 43 sequences were recovered for proviral DNA. Eighty-eight, 11, and 4 sequences of HIV RNA were collected in culture supernatants following the treatment with activation control, 7.5 nM RMD, and 2.5 nM RMD, respectively. Grey arrows indicate examples of full concordance between the sequence of proviral DNA and viral RNA induced either by RMD or activation control. No HIV RNA sequences were recovered in supernatants from cultures treated with control vehicle or 2 µM SAHA. Identified HIV DNA and RNA sequences were aligned and the phylogenetic tree was constructed using Clustal W and MEAG5.

Similar articles

Cited by

References

    1. DeJesus E, Rockstroh JK, Henry K, Molina JM, Gathe J, et al. (2012) Co-formulated elvitegravir, cobicistat, emtricitabine, and tenofovir disoproxil fumarate versus ritonavir-boosted atazanavir plus co-formulated emtricitabine and tenofovir disoproxil fumarate for initial treatment of HIV-1 infection: a randomised, double-blind, phase 3, non-inferiority trial. Lancet 379: 2429–2438. - PubMed
    1. Raffi F, Rachlis A, Stellbrink HJ, Hardy WD, Torti C, et al. (2013) Once-daily dolutegravir versus raltegravir in antiretroviral-naive adults with HIV-1 infection: 48 week results from the randomised, double-blind, non-inferiority SPRING-2 study. Lancet 381: 735–743. - PubMed
    1. Palmer S, Maldarelli F, Wiegand A, Bernstein B, Hanna GJ, et al. (2008) Low-level viremia persists for at least 7 years in patients on suppressive antiretroviral therapy. Proc Natl Acad Sci U S A 105: 3879–3884. - PMC - PubMed
    1. Chun TW, Davey RT Jr, Ostrowski M, Shawn Justement J, Engel D, et al. (2000) Relationship between pre-existing viral reservoirs and the re-emergence of plasma viremia after discontinuation of highly active anti-retroviral therapy. Nat Med 6: 757–761. - PubMed
    1. Papasavvas E, Kostman JR, Mounzer K, Grant RM, Gross R, et al. (2004) Randomized, controlled trial of therapy interruption in chronic HIV-1 infection. PLoS Med 1: e64. - PMC - PubMed

Publication types

MeSH terms