. 2014 Apr 15;5(7):1955-68.
doi: 10.18632/oncotarget.1885.

A new mosaic pattern in glioma vascularization: exogenous endothelial progenitor cells integrating into the vessels containing tumor-derived endothelial cells

Affiliations

A new mosaic pattern in glioma vascularization: exogenous endothelial progenitor cells integrating into the vessels containing tumor-derived endothelial cells

Xiao Chen et al. Oncotarget. .

Abstract

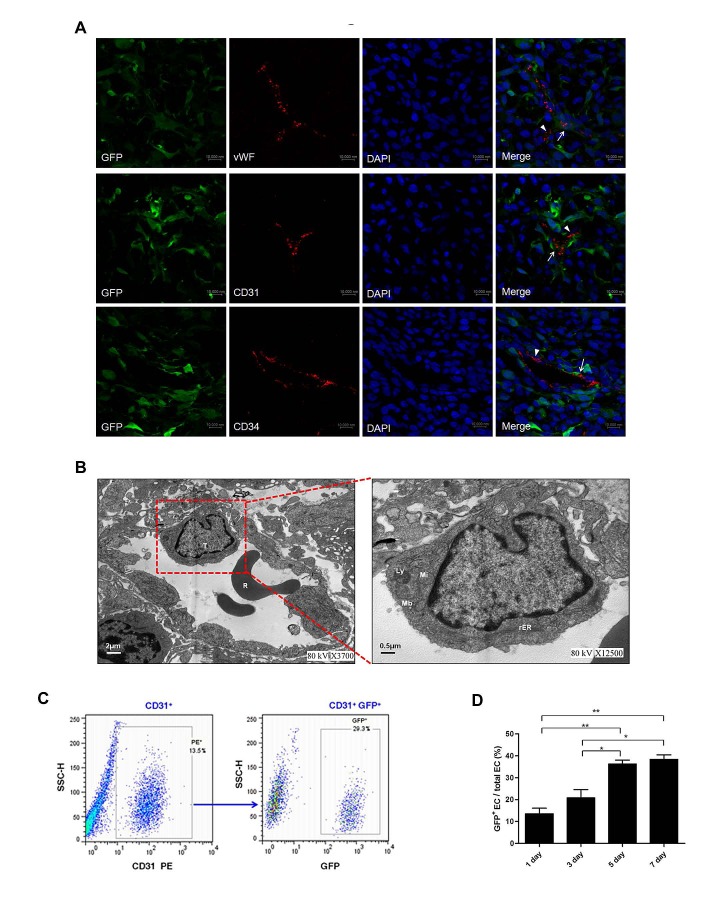
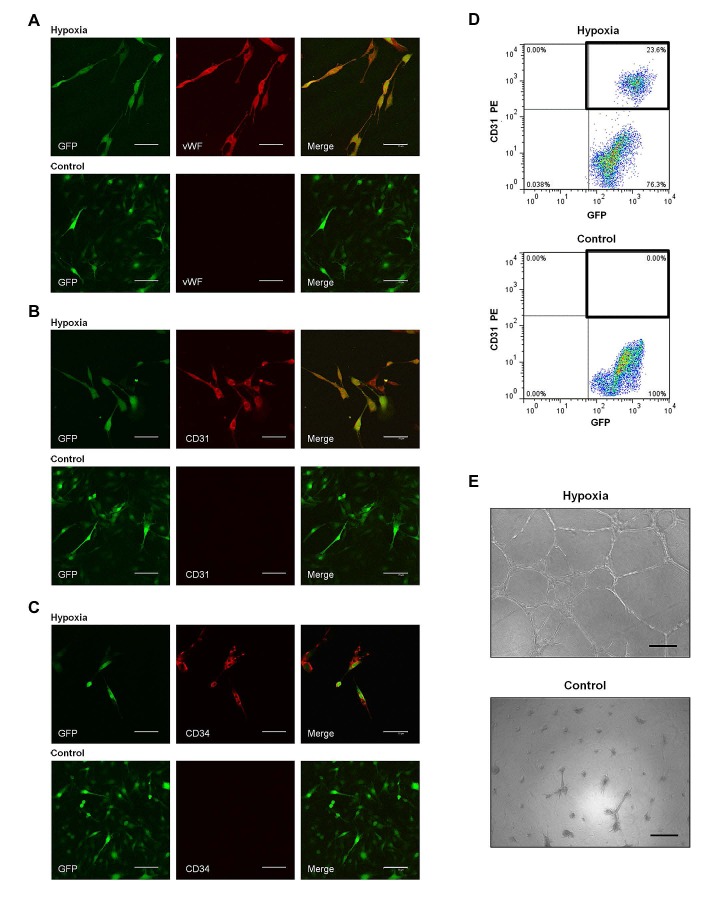
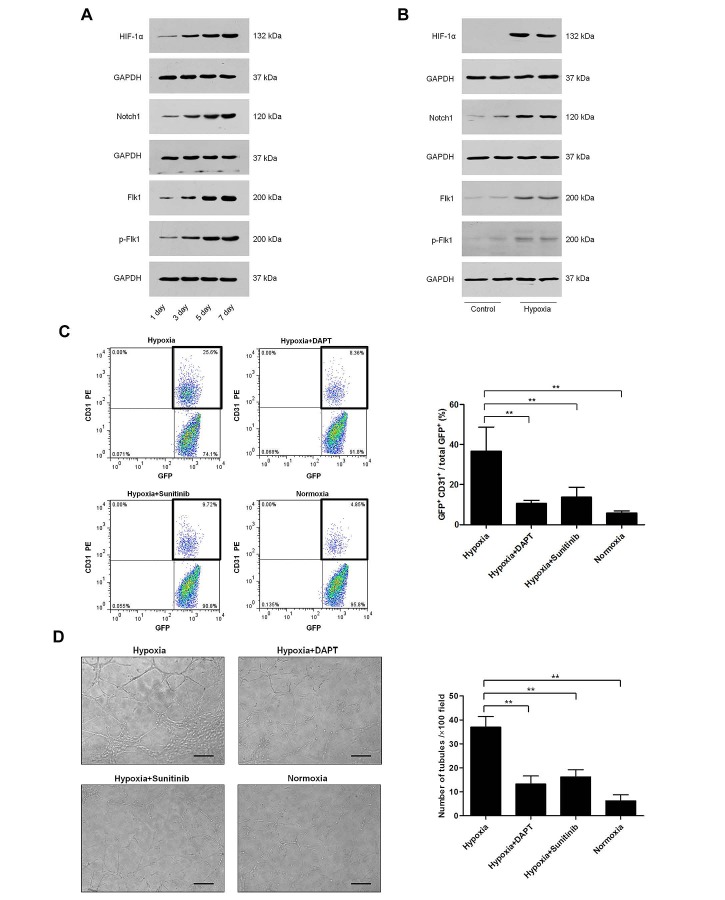
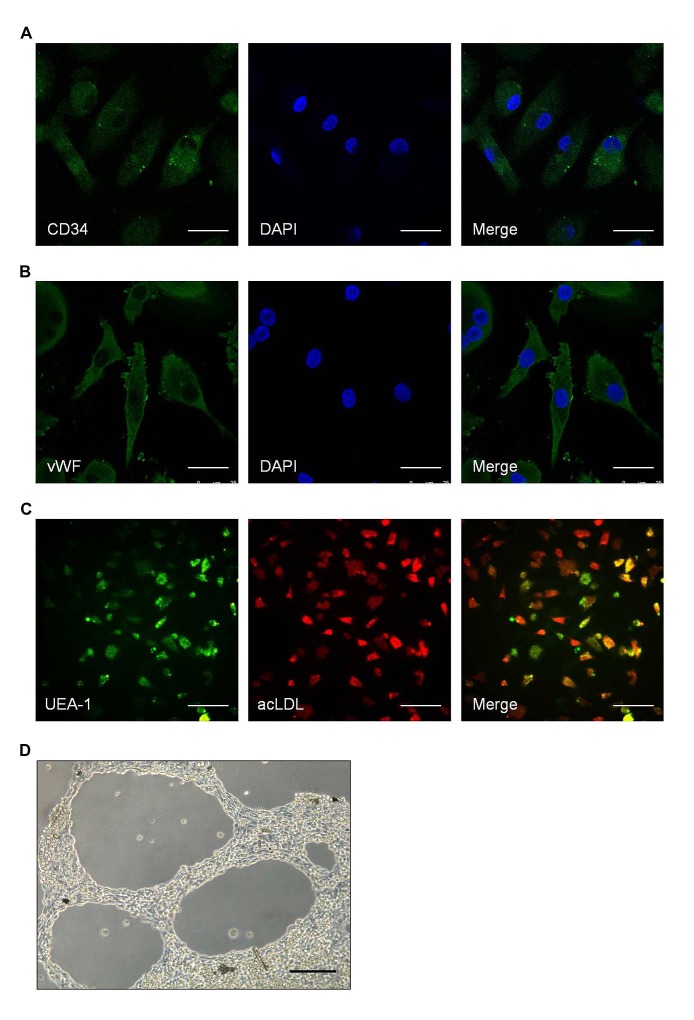
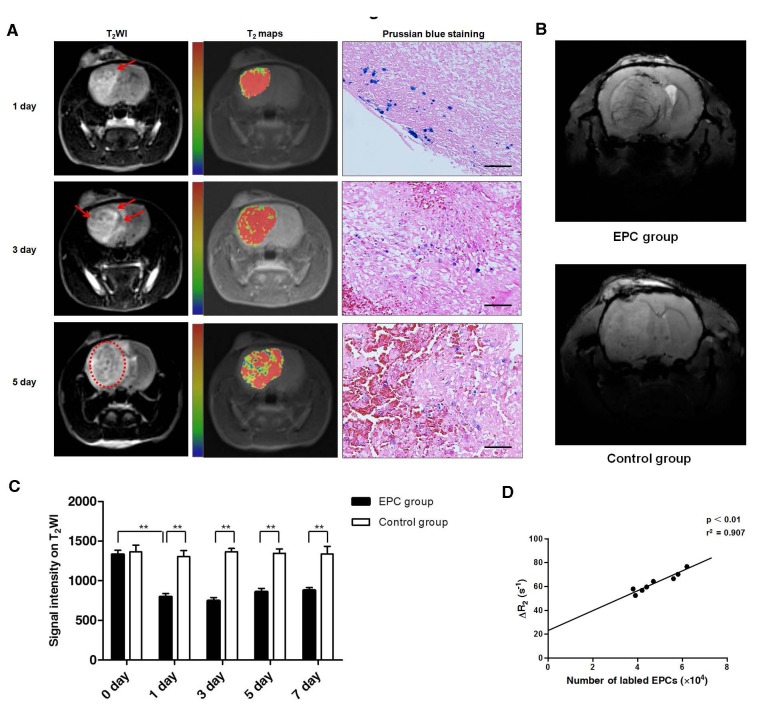
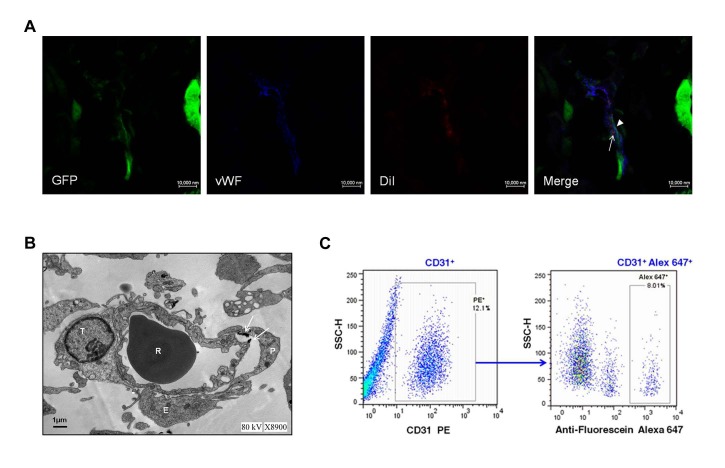
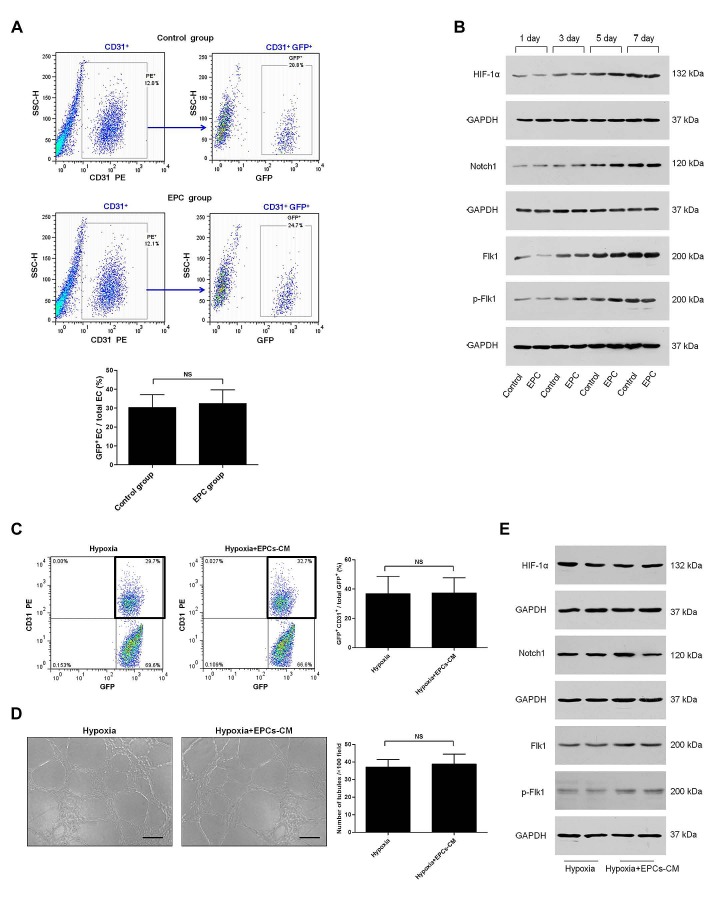
Emerging evidence suggests that glioma stem-like cells (GSCs) transdifferentiating into vascular endothelial cells (ECs) possibly contributes to tumor resistance to antiangiogenic therapy. Endothelial progenitor cells (EPCs), showing active migration and incorporation into neovasculature of glioma, may be a good vehicle for delivering genes to target GSCs transdifferentiation. Here, we found a new mosaic pattern that exogenous EPCs integrated into the vessels containing the tumor-derived ECs in C6 glioma rat model. Further, we evaluated the effect of these homing EPCs on C6 glioma cells transdifferentiation. The transdifferentiation frequency of C6 glioma cells and the expressions of key factors on GSCs transdifferentiation, i.e. HIF-1α, Notch1, and Flk1 in gliomas with or without EPCs transplantation showed no significant difference. Additionally, magnetic resonance imaging could track the migration and incorporation of EPCs into glioma in vivo, which was confirmed by Prussian blue staining. The number of magnetically labeled EPCs estimated from T2 maps correlated well with direct measurements of labeled cell counts by flow cytometry. Taken together, our findings may provide a rational base for the future application of EPCs as a therapeutic and imaging probe to overcome antiangiogenic resistance for glioma and monitor the efficacy of this treatment.


Figures

Figure 1
Figure 1. Transdifferentiation of C6 glioma cells into endothelial cells (ECs) in vivo
A. Representative images of tumor-derived ECs and regular ECs lined the vessel lumen in gliomas of the group with DPBS transplantation (control group). Regular ECs (arrowheads) expressed EC markers vWF, CD31, and CD34 (red), but not the tumor marker GFP. In contrast, tumor-derived ECs (arrows) expressed both GFP (green) and EC markers vWF, CD31, and CD34. Scale bar: 37.5 μm. B. Representative ultrastructural view of the vessel containing tumor-derived ECs. The right panel is the amplification of the frame in left panel, which shows that transdifferentiated C6 glioma cells had similar ultrastructural characteristics as ECs with many lysosomes, multivesicular bodies, plenty of mitochondria of small size with less cristae and a few rER in cytoplasms. T, tumor-derived ECs; R, erythrocyte; Mi, mitochondria; Ly, lysosome; rER, rough endoplasmic reticulum; Mb, multivesicular body. Scale bars are indicated. C. Representative result of flow cytometry for dissociated glioma tissue in control group. ECs were CD31+ and constituted 13.5% of the whole tumor (left), and GFP+ ECs (tumor-derived ECs) represented 29.3% of total ECs (right). D. Quantification of transdifferentiation frequency of C6 glioma cells in glioma tissue on day 1, 3, 5, 7 after DPBS transplantation in control group. Data are mean ± SD from three independent experiments. *, p<0.05; **, p<0.01.
Figure 2
Figure 2. Transdifferentiation of C6 glioma cells into ECs in vitro
A-C. Representative images of C6 glioma cells in hypoxia group (cultured in endothelial differentiation medium in hypoxia; top) and control group (cultured in DMEM/F12 in normoxia; bottom) in vitro. A, for vWF (red); B, for CD31 (red); C, for CD34 (red). Scale bar: 75 μm. D. Flow cytometry of CD31 and GFP expression in C6 glioma cells in hypoxia group (top) and control group (bottom). E. Tube formation assay of C6 glioma cells in hypoxia group (top) and control group (bottom). Scale bar: 100 μm.
Figure 3
Figure 3. Role of HIF-1α, Notch1 and Flk1 in C6 glioma cells transdifferentiation
A-B. Western blot analysis of HIF-1α, Notch1, Flk1, and p-Flk1 in gliomas of control group (A) and transdifferentiation-induced C6 glioma cells lysates (B). GAPDH blot serves as loading control. C. Flow cytometry of CD31 and GFP expression in C6 glioma cells cultured for 24 h in various conditions, including endothelial differentiation medium in hypoxia, endothelial differentiation medium containing DAPT (5 μM) or sunitinib (5 μM) in hypoxia, and endothelial differentiation medium in normoxia. Analysis of transdifferentiation frequency of C6 glioma cells in different groups. D. Tube formation assay of C6 glioma cells cultured in various conditions which were indicated before. The number of tubules in different groups were counted and analysed. Data are mean ± SD from three independent experiments. **, p<0.01.
Figure 4
Figure 4. Identifying the characteristics of spleen-derived endothelial progenitor cells (EPCs)
A-B. Representative images of the surface markers on spleen-derived EPCs. A for CD34 (green); B for vWF (green). Scale bar: 25 μm. C. Representative images of EPCs uptake of DiI-acLDL and binding of FITC-UEA-1. Scale bar: 100 μm. D. Representative images of EPCs angiogenesis in vitro. Scale bar: 100 μm
Figure 5
Figure 5. Magnetic resonance imaging (MRI) tracking and quantifying of EPCs incorporation into tumor in vivo
A. Representative T2-weighted imaging (T2WI) and T2 maps images of rats with glioma on 1, 3, 5 days after EPCs transplantation from EPC group using 3.0 T MRI. Glioma was the region with hyperintensity on T2WI images. Point-like or linear hypointensity (dark area; arrows or dotted ring) was found in glioma and the dark area enlarged as time went on. The same signal changes were found in T2 maps. In T2 maps, red and blue represent relative higher- and lower-value, respectively. Histology with Prussian blue staining showed iron-positive cells (blue particles) at the corresponding site of areas of point-like or linear hypointensity on MRI. Scale bar: 100 μm. B. Representative susceptibility-weighted imaging (SWI) of rats with glioma on 3 days after transplantation in EPC group and control group using 7.0 T MRI. Hypointensity was along/around the vessels in EPC group, while no such changes were found in control group. C. Changes of signal intensity on T2 maps in EPC group and control group were analysed. Data are mean ± SD from three independent experiments. **, p<0.01. D. Correlation between number of labeled EPCs detected by flow cytometry and MRI △R2 values. Regression line: y=23.359+8.214x, r2=0.907, p<0.01.
Figure 6
Figure 6. Exogenous endothelial progenitor cells (EPCs) integrating into the vessels containing the tumor-derived ECs
A. Representative images of exogenous EPCs, tumor-derived ECs and regular ECs lined the vessel lumen in gliomas of EPC group. EPCs (arrows) were labeled with DiI (red) but also expressed EC marker CD31 (blue). In contrast, tumor derived-ECs (arrowheads) expressed both the GFP (green) and CD31, and regular ECs only expressed CD31. Scale bar: 10 μm. B. Representative ultrastructural view of regular ECs, tumor-derived ECs, and USPIO-labeled EPCs composed a vessel. T, tumor-derived EC; P, EPC; E, EC; R, erythrocyte. Arrows depict the magnetic nanoparticle USPIO. Scale bar: 1μm. C. Representative result of flow cytometry for dissociated glioma tissue in EPC group. ECs were CD31+ and constituted 12.1% of the whole tumor (left), and CD31+ Alex 647+ (exogenous EPCs) represented 8.01% of total ECs (right).
Figure 7
Figure 7. Effects of exogenous EPCs on C6 glioma cells transdifferentiation
A. Representative result of flow cytometry for dissociated glioma tissue in control group (top) and EPC group (middle). Analysis of transdifferentiation frequency of C6 glioma cells in gliomas of these two groups (bottom). B. Western blot analysis of HIF-1α, Notch1, Flk1, and p-Flk1 in gliomas of control group and EPC group on 1, 3, 5, 7 days after DPBS or EPCs transplantation. GAPDH blot serves as loading control. C. Flow cytometry of CD31 and GFP expression in C6 glioma cells cultured for 24 h in two conditions, including endothelial differentiation medium (left) or endothelial differentiation medium containing 50% (v/v) EPCs conditioned medium (EPCs-CM; middle) in hypoxia. Analysis of transdifferentiation frequency of C6 glioma cells in these two groups (right). D. Tube formation assay of C6 glioma cells cultured in these two conditions (left, middle). The number of tubules was counted (right). E. Western blot analysis of HIF-1α, Notch1, Flk1, and p-Flk1 in C6 glioma cells cultured in these two conditions. GAPDH blot serves as loading control. Data are mean ± SD from three independent experiments. NS, no significant difference.

References

    1. Wen PY, Kesari S. Malignant gliomas in adults. N Engl J Med. 2008;359(5):492–507. - PubMed
    1. Vredenburgh JJ, Desjardins A, Herndon JE, 2nd, Dowell JM, Reardon DA, Quinn JA, Rich JN, Sathornsumetee S, Gururangan S, Wagner M, Bigner DD, Friedman AH, Friedman HS. Phase II trial of bevacizumab and irinotecan in recurrent malignant glioma. Clin Cancer Res. 2007;13(4):1253–1259. - PubMed
    1. Kreisl TN, Kim L, Moore K, Duic P, Royce C, Stroud I, Garren N, Mackey M, Butman JA, Camphausen K, Park J, Albert PS, Fine HA. Phase II trial of single-agent bevacizumab followed by bevacizumab plus irinotecan at tumor progression in recurrent glioblastoma. J Clin Oncol. 2009;27(5):740–745. - PMC - PubMed
    1. Rubenstein JL, Kim J, Ozawa T, Zhang M, Westphal M, Deen DF, Shuman MA. Anti-VEGF antibody treatment of glioblastoma prolongs survival but results in increased vascular cooption. Neoplasia. 2000;2(4):306–314. - PMC - PubMed
    1. Paez-Ribes M, Allen E, Hudock J, Takeda T, Okuyama H, Vinals F, Inoue M, Bergers G, Hanahan D, Casanovas O. Antiangiogenic therapy elicits malignant progression of tumors to increased local invasion and distant metastasis. Cancer Cell. 2009;15(3):220–231. - PMC - PubMed

Publication types

MeSH terms

Substances

LinkOut - more resources