. 2014 May 15;306(10):G826-38.
doi: 10.1152/ajpgi.00357.2013. Epub 2014 Apr 10.

Intestinal alkaline phosphatase promotes gut bacterial growth by reducing the concentration of luminal nucleotide triphosphates

Affiliations

Intestinal alkaline phosphatase promotes gut bacterial growth by reducing the concentration of luminal nucleotide triphosphates

Madhu S Malo et al. Am J Physiol Gastrointest Liver Physiol. .

Abstract

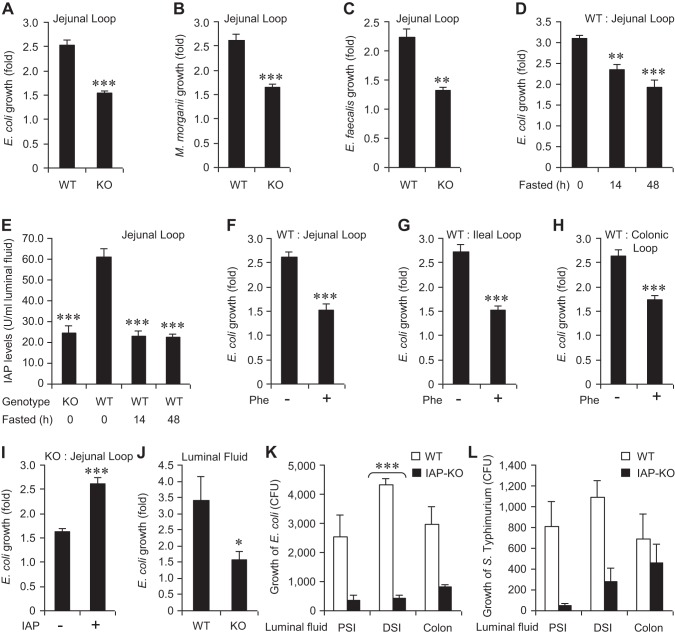
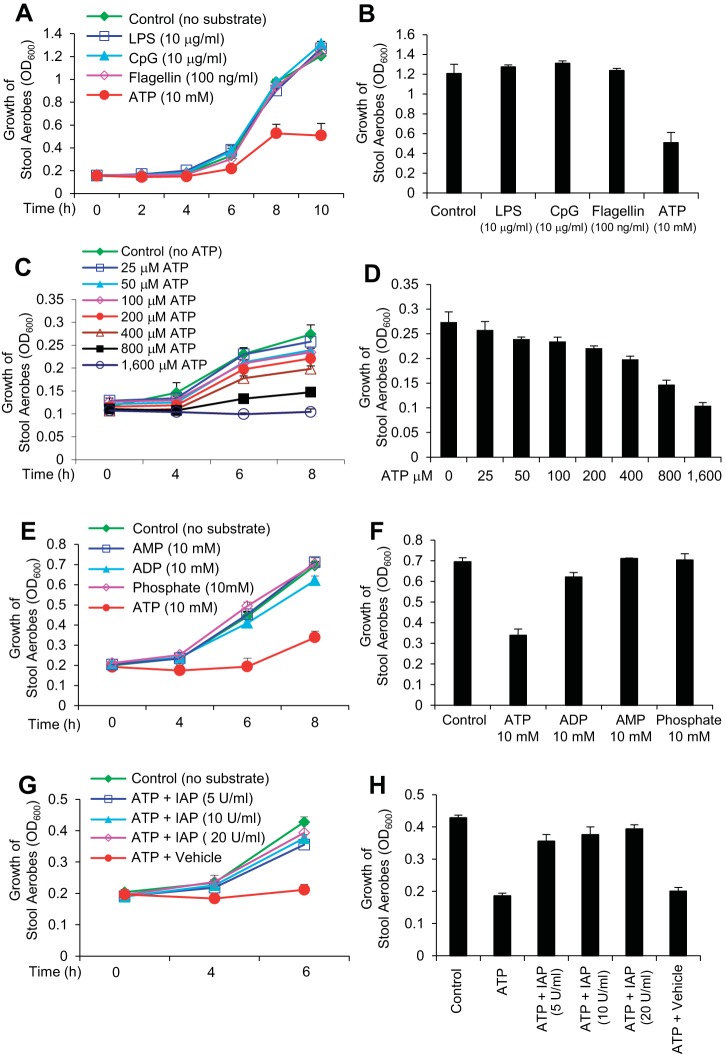
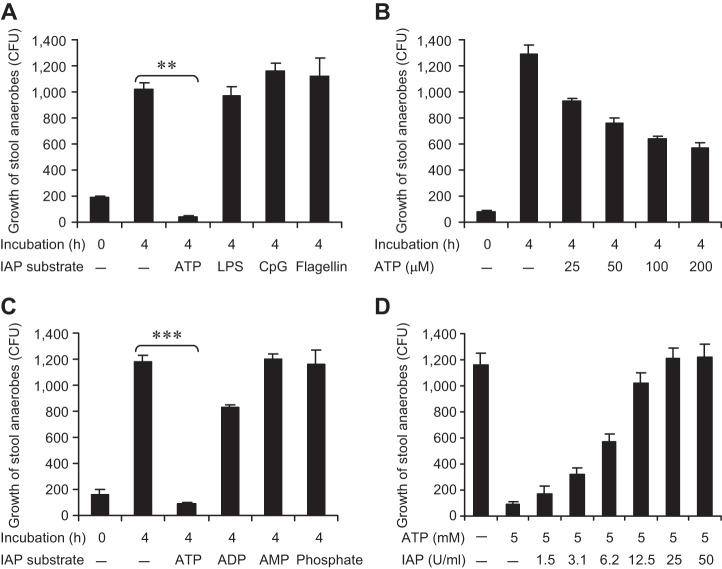
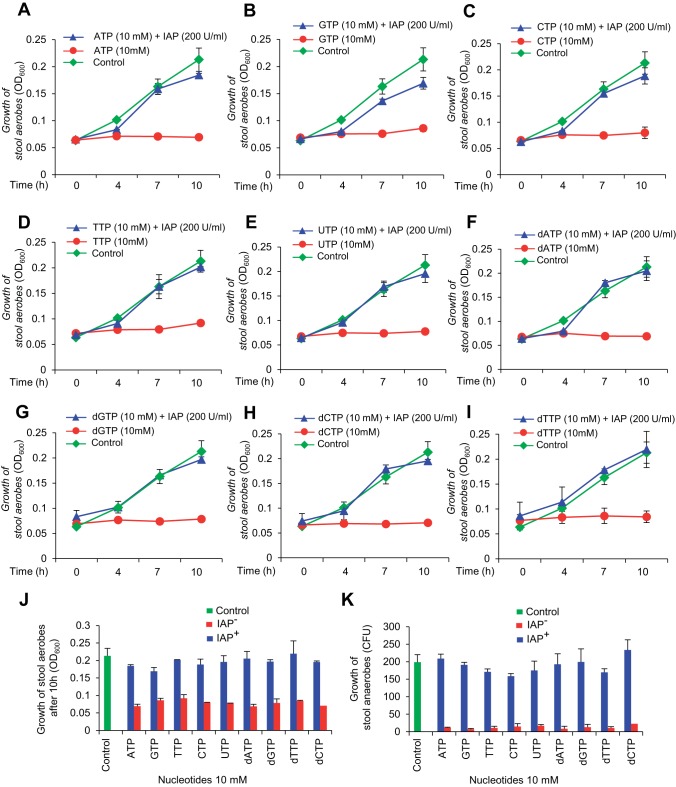
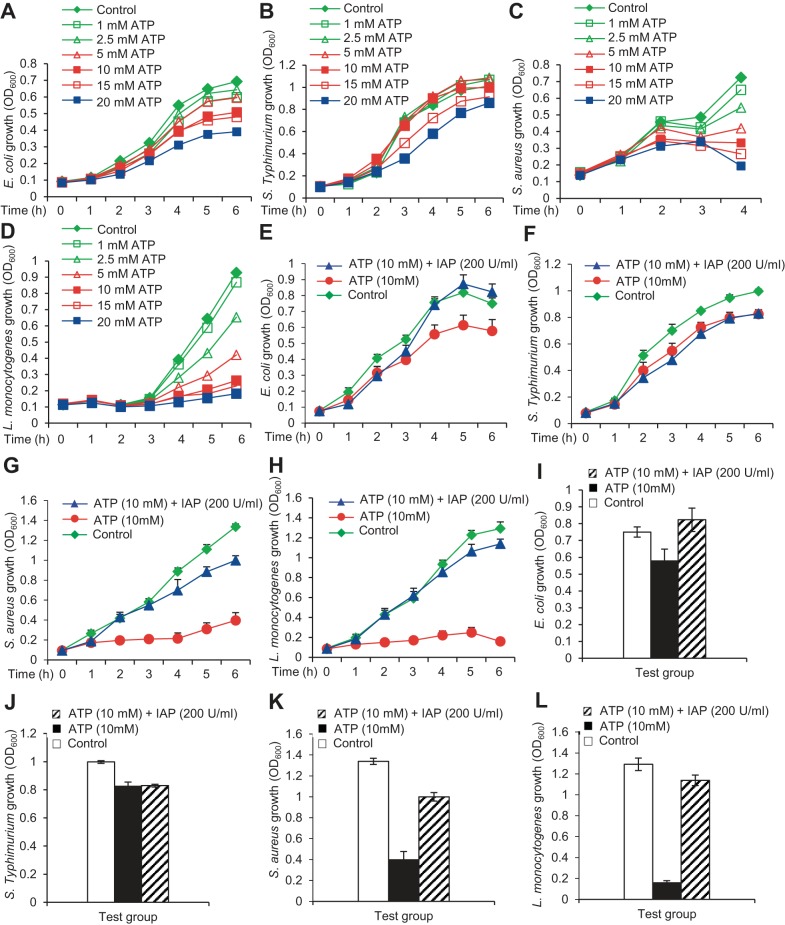
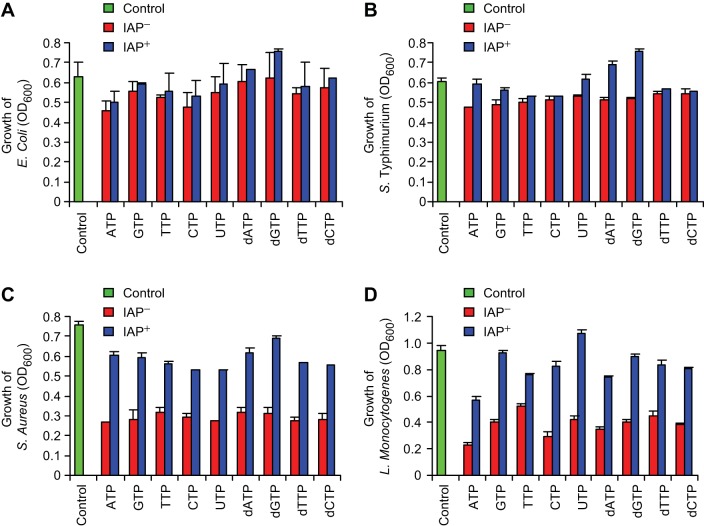
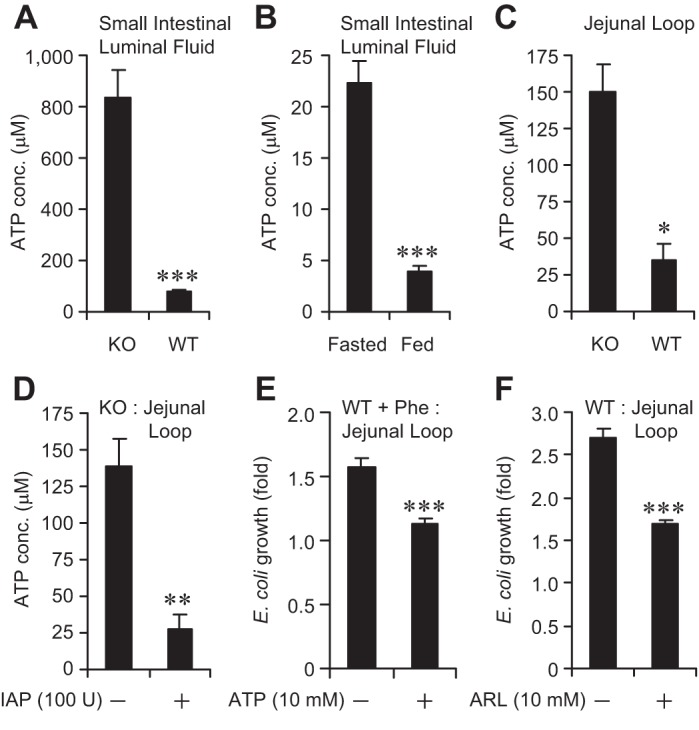
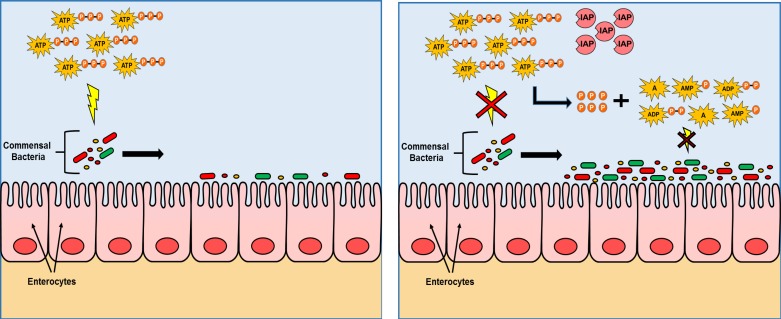
The intestinal microbiota plays a pivotal role in maintaining human health and well-being. Previously, we have shown that mice deficient in the brush-border enzyme intestinal alkaline phosphatase (IAP) suffer from dysbiosis and that oral IAP supplementation normalizes the gut flora. Here we aimed to decipher the molecular mechanism by which IAP promotes bacterial growth. We used an isolated mouse intestinal loop model to directly examine the effect of exogenous IAP on the growth of specific intestinal bacterial species. We studied the effects of various IAP targets on the growth of stool aerobic and anaerobic bacteria as well as on a few specific gut organisms. We determined the effects of ATP and other nucleotides on bacterial growth. Furthermore, we examined the effects of IAP on reversing the inhibitory effects of nucleotides on bacterial growth. We have confirmed that local IAP bioactivity creates a luminal environment that promotes the growth of a wide range of commensal organisms. IAP promotes the growth of stool aerobic and anaerobic bacteria and appears to exert its growth promoting effects by inactivating (dephosphorylating) luminal ATP and other luminal nucleotide triphosphates. We observed that compared with wild-type mice, IAP-knockout mice have more ATP in their luminal contents, and exogenous IAP can reverse the ATP-mediated inhibition of bacterial growth in the isolated intestinal loop. In conclusion, IAP appears to promote the growth of intestinal commensal bacteria by inhibiting the concentration of luminal nucleotide triphosphates.

Keywords: CpG DNA; dysbiosis; flagellin; gut flora; intestinal loop model; lipopolysaccharides; microbiotal homeostasis.


Figures

Fig. 1.
Fig. 1.
Lower levels of endogenous intestinal alkaline phosphatase (IAP) reduce bacterial growth. Laparotomy was performed on mice under general anesthesia, a 5-cm loop was constructed, and ∼1,000 colony-forming units (CFU) of a specific bacterial species were instilled by injection (100 μl) into the loop. After 2 h, the loop was dissected out, homogenized, and plated on selective media for overnight growth at 37°C (see materials and methods for details). Bacterial growth in the jejunal loops of wild-type (WT) and IAP-knockout (KO) mice. A: growth of Escherichia coli (n = 10 in each group). B: growth of Morganella morganii (n = 5 in each group). C: growth of Enterococcus faecalis (n = 5 in each group). D: growth of E. coli in the jejunal loop of animals fasted for 14 and 48 h. E: IAP levels in the jejunal loops of animals fasted for 14 and 48 h. Growth of E. coli in the animals treated with phenylalanine (Phe). F: jejunal loop. G: ileal loop. H: colonic loop. I: exogenous IAP (10 U) enhances E. coli growth in the jejunal loop. J: E. coli growth is reduced in the intestinal luminal fluid of IAP-KO mice compared with WT mice. Bacterial growth in the luminal fluid from the proximal small intestine (PSI), distal small intestine (DSI), and colon of IAP-KO mice compared with WT mice. K: growth of E. coli was significantly reduced in DSI luminal fluid of IAP-KO mice compared with WT mice. L: growth of Salmonella typhimurium. Groups of mice were euthanized and the luminal fluid from different segments or the entire intestine of each mouse was collected. Approximately 1,000 CFU of bacteria were added to the fluid and incubated for 2 h at 37°C. Values are expressed as means ± SE. Statistical significance between 2 groups was tested by the 2-tailed Student's t-test. *P < 0.05, **P < 0.01, ***P < 0.001.
Fig. 2.
Fig. 2.
ATP inhibits the growth of stool aerobic bacteria in vitro. Mouse stool samples were collected fresh directly in Brain Heart Infusion (BHI) media, homogenized, serially diluted and then cultured under aerobic conditions. For aerobic growth, each bacterial culture (200 μl) was grown in 8 wells of a 96-well clear-bottom plate at 37°C in a shaking incubator, and absorbance (OD600) was determined at indicated time points (see materials and methods). A: effects of different targets of IAP on stool aerobes. B: the effect of ATP on bacterial growth was most evident when optical densities (ODs) were compared after 10 h of incubation [1-way ANOVA F(4, 38) = 4.49, P value < 0.01; Tukey's post hoc test: P value < 0.05]. C: dose-response effects of ATP on stool aerobes. D: the highest effect of low concentration of ATP on bacterial growth was evident after 8 h of incubation [1-way ANOVA: F(9, 68) = 49.30, P value < 0.001; Tukey's post hoc test: P value = 0.015 for 200 μM of ATP, P values < 0.001 for 400, 800, 1,600 μM of ATP]. E: effects of ATP derivatives on stool aerobes. F: these effects are also illustrated at the final time point. G: IAP reverses the inhibitory effects of ATP on stool aerobic bacterial growth. H: IAP abolished the effects of ATP and dose dependently increased bacterial growth [1-way ANOVA: F(5, 83) = 13.97, P value < 0.001; Tukey's post hoc test: P values < 0.001]. Values for bacterial growth are expressed as average absorbance (OD600) ± SD. The experiment was repeated at least 3 times showing similar results.
Fig. 3.
Fig. 3.
ATP inhibits the growth of stool anaerobic bacteria in vitro. Mouse stool samples were collected fresh directly in BHI media, homogenized, serially diluted, and then cultured under anaerobic conditions. For the growth of stool anaerobes, cultures were grown in a sealed plastic bag containing CO2-producing gas pack and anaerobic condition indicators for 4 h at 37°C. Then the cultures were plated on Brucella (5% horse blood) agar plates and incubated in a sealed plastic bag containing CO2-producing gas pack and anaerobic condition indicators for 3 days at 37°C (see materials and methods). A: effects of different targets of IAP on the growth of stool anaerobes. B: dose-response effects of ATP on the growth of stool anaerobes. C: effects of ATP derivatives on the growth of stool anaerobes. D: IAP reverses the inhibitory effects of ATP on the growth of stool anaerobes. Values are expressed as mean CFU ± SE. Statistics: 2-tailed Student's t-test; **P < 0.01, ***P < 0.001. The experiment was repeated at least 3 times showing similar results.
Fig. 4.
Fig. 4.
IAP reverses the bacterial growth inhibition by various nucleotide triphosphates. Mouse stool samples were collected and grown under aerobic and anaerobic conditions as described in Figs. 2 and 3 (also see materials and methods). Cultures were treated with a nucleotide (10 mM) ± IAP (200 U/ml). Growth of stool aerobes in different nucleotide triphosphates. A: ATP. B: GTP. C: CTP. D: TTP. E: UTP. F: dATP. G: dGTP. H: dCTP. I: dTTP. Values for aerobic bacterial growth are expressed as average absorbance (OD600) ± SD. The experiment was repeated at least 3 times showing similar results [2-way repeated-measures ANOVA: effect of time: F(3, 19) = 1,330.55, P value < 0.001; interaction of time and IAP: F(3, 19) = 449.87, P value < 0.001; interaction of time and nucleotide triphosphate: F(27, 63) = 2.32, P value < 0.01; interaction of time, IAP, and nucleotide triphosphate: F(24, 63) = 2.70, P value < 0.01; between-groups differences for IAP: F(1, 21) = 516.65, P value < 0.001; between-groups differences for nucleotide triphosphates: F(9, 21) = 11.61, P value < 0.001; Tukey's post hoc test: P value < 0.05 for dTTP; P values < 0.001 for all other nucleotide triphosphates]. J: dose-response curve at the end point of the experiment (10 h) [2-way ANOVA: effect of IAP: F(1, 39) = 586.13, P value < 0.001; Effect of nucleotide triphosphate: F(9, 39) = 13.65, P value < 0.001; interaction of IAP and nucleotide triphosphate: F(9, 39) = 8.44, P value < 0.001; Tukey's post hoc test: P value < 0.05 for dTTP; P values < 0.001 for all other nucleotide triphosphates; Tukey's post hoc test: P value < 0.01 for GTP; P values < 0.001 for all other nucleotide triphosphates]. K: growth of stool anaerobes in different nucleotides. Values are expressed as mean CFU ± SE. The experiment was repeated at least 3 times showing similar results.
Fig. 5.
Fig. 5.
ATP differentially inhibits the growth of specific bacteria. Each bacterial culture (200 μl) was grown in 8 wells of a 96-well clear-bottom plate at 37°C in a shaking incubator, and absorbance (OD600) was determined at indicated time points. Dose-response effects of ATP (1–20 mM). A: E. coli. B: Salmonella typhimurium. C: Staphylococcus aureus. D: Listeria monocytogenes. Effects of ATP (10 mM) ± IAP (200 U/ml) on the growth of E. coli (E; P = 0.029), S. typhimurium (F, P = 0.18), S. aureus (G, P = 0.003), and L. monocytogenes (H, P = 0.007). IL: these effects are also illustrated at the final time points. Values for bacterial growth are expressed as average absorbance (OD600) ± SD. The experiment was repeated at least 3 times showing similar results. Statistics: the statistical analysis was performed comparing the OD values in the IAP vs. Vehicle group using 2-tailed paired Student's t-test. Note: to avoid cluttering the error bars are not shown in AD.
Fig. 6.
Fig. 6.
Nucleotide triphosphates preferentially inhibit gram-positive bacteria. Each bacterial culture (200 μl) was grown in 8 wells of a 96-well clear-bottom plate at 37°C in a shaking incubator, and absorbance (OD600) was determined at indicated time points. Each culture was treated with an individual nucleotide (10 mM) ± IAP (200 U/ml). Growth was recorded every 2 h and the data presented here are from the 6-h time point. Values for bacterial growth are expressed as average absorbance (OD600) ± SD. The experiment was repeated at least 3 times showing similar results.
Fig. 7.
Fig. 7.
ATP inhibits bacterial growth in vivo. The small intestine was dissected out and luminal fluid was collected by gentle squeezing, then centrifuged, and the supernatant was obtained for ATP assay (see materials and methods). For determining ATP concentration and studying the effects of ATP in vivo, laparotomy was performed on mice (n = 5 per group) under general anesthesia and a 5-cm jejunal loop was constructed. Approximately 1,000 CFU of a specific bacterial species were instilled by injection into the loop. After 2 h, the loop was dissected out, homogenized, and plated on selective media for overnight growth at 37°C (see materials and methods for details). A: ATP concentrations (conc.) in the small intestinal luminal fluids of WT and IAP-KO mice. B: ATP concentrations in the small intestinal luminal fluids of WT mice fasted for 14 h. C: ATP concentrations in the jejunal loops of WT and IAP-KO mice. D: ATP concentrations in the jejunal loops of IAP-KO mice receiving IAP (100 U: injection directly into the loop). E: growth of E. coli in the jejunal loops of WT mice pretreated with 10 mM phenylalanine in the drinking water. F: growth of E. coli in the jejunal loops of WT mice receiving the ecto-ATPase inhibitor ARL 67156 (ARL; 10 mM) injection directly into the loop. Values are expressed as means ± SE. Statistics: 2-tailed Student's t-test; *P < 0.05, **P < 0.01, ***P < 0.001.
Fig. 8.
Fig. 8.
Gut microbiota live in symbiosis with the host. The brush border enzyme IAP appears to play a central role in regulating the microbiota through a mechanism that involves the dephosphorylation of luminal ATP. ATP (and similarly other nucleotide triphosphates not shown in this figure) exerts an inhibitory effect on the growth and survival of a wide spectrum of bacteria. By dephosphorylating ATP, IAP blocks this inhibitory effect, resulting in greater numbers of gut bacteria. Both aerobes and anaerobes are affected by ATP. Note: The selected gram-positive bacteria (L. monocytogenes and S. aureus) were more significantly affected by ATP and consequently IAP compared with the tested gram-negatives (non-pathogenic E. coli and pathogenic Salmonella). A, adenosine, P, phosphate.

Comment in

Similar articles

Cited by

References

    1. Alam SN, Yammine H, Moaven O, Ahmed R, Moss AK, Biswas B, Muhammad N, Biswas R, Raychowdhury A, Kaliannan K, Ghosh S, Ray M, Hamarneh SR, Barua S, Malo NS, Bhan AK, Malo MS, Hodin RA. Intestinal alkaline phosphatase prevents antibiotic-induced susceptibility to enteric pathogens. Ann Surg 259: 715–722, 2014 - PMC - PubMed
    1. Atarashi K, Nishimura J, Shima T, Umesaki Y, Yamamoto M, Onoue M, Yagita H, Ishii N, Evans R, Honda K, Takeda K. ATP drives lamina propria TH17 cell differentiation. Nature 455: 808–812, 2008 - PubMed
    1. Balakrishnan M, Floch MH. Prebiotics, probiotics and digestive health. Curr Opin Clin Nutr Metab Care 15: 580–585, 2012 - PubMed
    1. Bates JM, Akerlund J, Mittge E, Guillemin K. Intestinal alkaline phosphatase detoxifies lipopolysaccharide and prevents inflammation in zebrafish in response to the gut microbiota. Cell Host Microbe 2: 371–382, 2007 - PMC - PubMed
    1. Bengmark S. Nutrition of the critically ill — a 21st-century perspective. Nutrients 5: 162–207, 2013 - PMC - PubMed

Publication types

MeSH terms