

Variation in diagnostic coding of patients with pneumonia and its association with hospital risk-standardized mortality rates: a cross-sectional analysis
- PMID: 24723078
- PMCID: PMC6946057
- DOI: 10.7326/M13-1419
Variation in diagnostic coding of patients with pneumonia and its association with hospital risk-standardized mortality rates: a cross-sectional analysis
Abstract
Background: Most U.S. hospitals publicly report 30-day risk-standardized mortality rates for pneumonia. Rates exclude severe cases, which may be assigned a secondary diagnosis of pneumonia and a principal diagnosis of sepsis or respiratory failure. By assigning sepsis and respiratory failure codes more liberally, hospitals might improve their reported performance.
Objective: To examine the effect of the definition of pneumonia on hospital mortality rates.
Design: Cross-sectional study.
Setting: 329 U.S. hospitals.
Patients: Adults hospitalized for pneumonia (as a principal diagnosis or secondary diagnosis paired with a principal diagnosis of sepsis or respiratory failure) between 2007 and 2010.
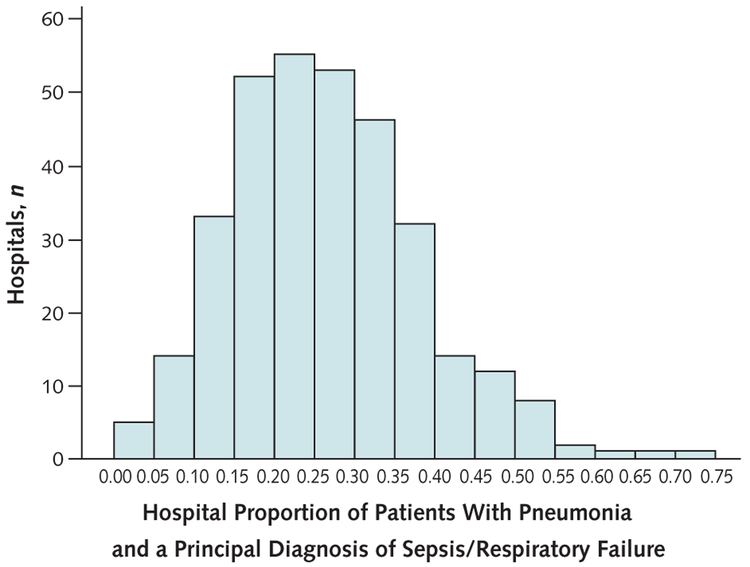
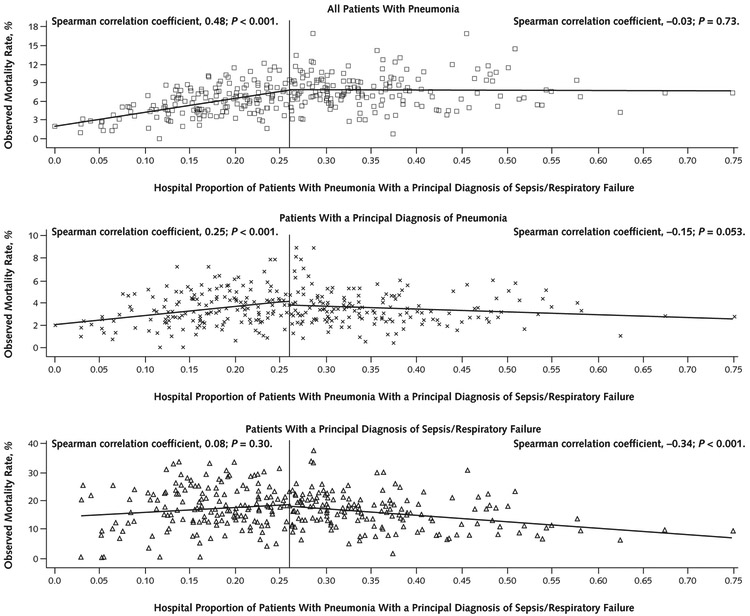
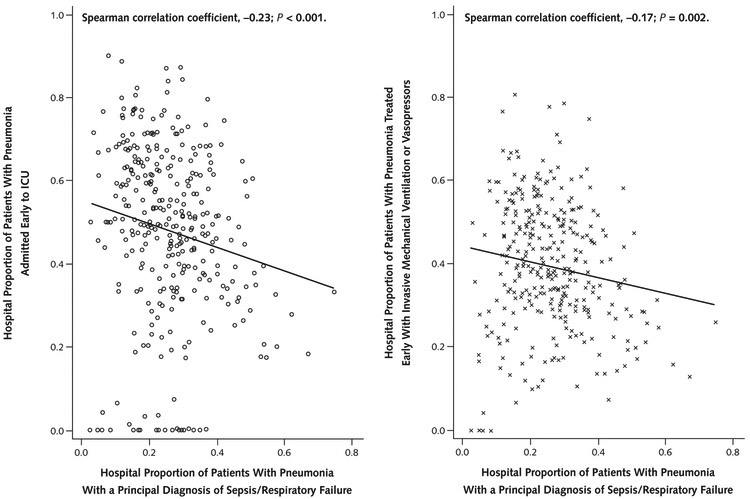
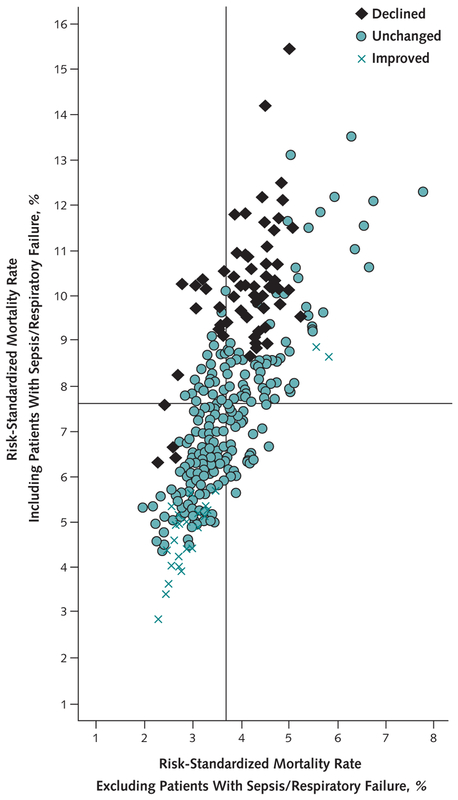
Measurements: Proportion of patients with pneumonia coded with a principal diagnosis of sepsis or respiratory failure and risk-standardized mortality rates excluding versus including a principal diagnosis of sepsis or respiratory failure.
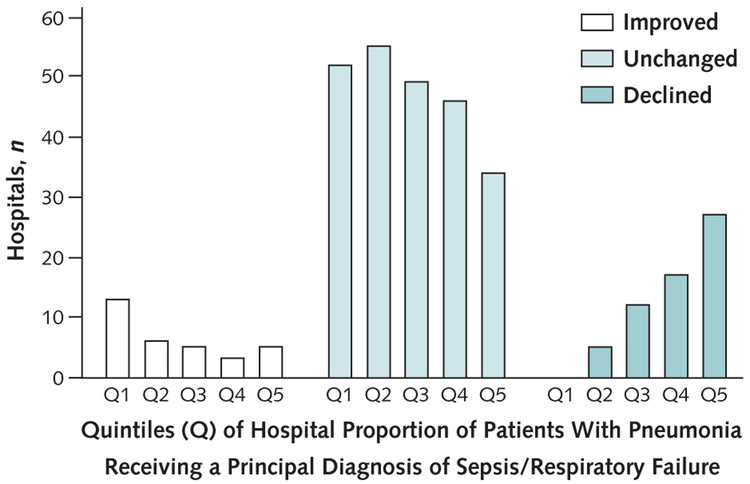
Results: When the definition of pneumonia was limited to patients with a principal diagnosis of pneumonia, the risk-standardized mortality rate was significantly better than the mean in 4.3% of hospitals and significantly worse in 6.4%. When the definition was broadened to include patients with a principal diagnosis of sepsis or respiratory failure, this rate was better than the mean in 11.9% of hospitals and worse in 22.8% and the outlier status of 28.3% of hospitals changed. Among hospitals in the highest quintile of proportion of patients coded with a principal diagnosis of sepsis or respiratory failure, outlier status under the broader definition improved in 7.6% and worsened in 40.9%. Among those in the lowest quintile, 20.0% improved and none worsened.
Limitation: Only inpatient mortality was studied.
Conclusion: Variation in use of the principal diagnosis of sepsis or respiratory failure may bias efforts to compare hospital performance regarding pneumonia outcomes.
Primary funding source: Agency for Healthcare Research and Quality.
Conflict of interest statement
Figures
Comment in
-
Measuring pneumonia-related mortality using administrative data: coding and consequences.Ann Intern Med. 2014 Mar 18;160(6):430-1. doi: 10.7326/M14-0199. Ann Intern Med. 2014. PMID: 24723082 No abstract available.
References
-
- Elixhauser A, Owens P . Reasons for Being Admitted to the Hospital through the Emergency Department, 2003 Healthcare Cost and Utilization Project Statistical Brief 2. Rockville, MD: Agency for Healthcare Research and Quality; 2006. Accessed at www.hcup-us.ahrq.gov/reports/statbriefs/sb2.pdf on 19 August 2013. - PubMed
-
- Werner RM, Bradlow ET. Relationship between Medicare’s hospital compare performance measures and mortality rates. JAMA. 2006;296:2694–702. [PMID: 17164455] - PubMed
-
- Ryan AM, Burgess JF Jr, Tompkins CP, Wallack SS. The relationship between Medicare’s process of care quality measures and mortality. Inquiry. 2009; 46:274–90. [PMID: 19938724] - PubMed
-
- Centers for Medicare & Medicaid Services. 30-Day Death and Readmission Measures. 2012. Accessed at https://data.medicare.gov/Hospital-Compare/Hospital-Outcome-Of-Care-Meas... on 19 August 2013.
Publication types
MeSH terms
Grants and funding
LinkOut - more resources
Full Text Sources
Other Literature Sources